Abstract
To improve the reliability and lifespan of wind turbines, this paper takes the two-stage fixed shaft gearbox experimental platform of wind turbines as the research object. Based on Hertz contact theory, the oil film pressure and thickness in the contact area are solved by combining the equations of elastohydrodynamic lubrication and the Newton Raphson method; And the lubrication characteristics of the transmission system were analyzed to verify the correctness of the method; At the same time, in response to partial load phenomenon caused by system coupling deformation, genetic algorithm was selected to modify the gear teeth. The results show that the max unit load on the tooth face and the maximum stress of tooth root decreased by up to 26.48 % and up to 20.35 % respectively after modification which can improve the uneven distribution of oil film and the lubrication performance of the tooth surface.
Highlights
- This article presents a computing method to obtain the oil film pressure and thickness in the contact area which combining the equations of elastohydrodynamic lubrication and the Newton Raphson method.
- The lubrication characteristics of the transmission system were analyzed to verify the correctness of the method.
- In response to partial load phenomenon caused by system coupling deformation, genetic algorithm was selected to modify the gear teeth, improving the uneven distribution of oil film and the lubrication performance of the tooth surface.
1. Introduction
With the continuous progress of industrial level, the size of wind turbines continues to increase, and the relatively harsh working environment of wind turbines also leads to an increase in corresponding faults. Usually, about 20 % of wind turbine faults are caused by gearbox failure, and about 60 % of faults in gearbox come from gears [1]. The main forms of gear failure are pitting, wear, fatigue, bonding, etc. These failure situations can be effectively improved through lubrication to a certain extent. Therefore, understanding, understanding, and mastering the dynamic characteristics of gear lubrication systems and tooth surface lubrication contact performance have certain research significance for studying the vibration and noise of transmission systems and improving transmission performance.
Good lubrication performance can effectively reduce the wear and contact fatigue of interacting tooth surfaces, and improve their durability [2]. Usually, the contact surfaces of high gear pairs and other high gear pairs will form elastohydrodynamic lubrication under high pressure. The lubricating oil film can effectively separate the two contact surfaces, thereby reducing tooth friction and wear, reducing vibration and noise [3].
The transition from classical lubrication theory to elastohydrodynamic lubrication theory has played a driving role in the research progress of gear lubrication to a certain extent. Reasonably designing gear lubrication systems can help improve their service life [4]. Scholars at home and abroad have established a certain theoretical foundation for research. H. P. Evans et al. discussed the impact of oil film thickness between tooth surfaces less than the roughness feature height on lubrication characteristics [5]. S. Li et al. proposed a transient non Newtonian mixed elastohydrodynamic lubrication (EHL) model for involute spur gear tooth contact, which differs from the contact between two cylindrical rollers. The contact of spur gears undergoes many time-varying contact parameters, including normal load, curvature radius, and suction speed. The lubrication behavior under rough conditions under different operating conditions was studied [6]. In 2014, CaichaoZhu and MingyongLiu et al. considered the geometric changes and non Newtonian properties of helical gear pairs and established a thermal finite line contact elastohydrodynamic model for helical gear pairs. They applied the generalized Reynolds equation and multigrid method to solve the model. The analysis showed that the main difference between Ree Eyring non Newtonian fluid and Newtonian fluid was the membrane temperature and shear stress [7]. Mankoun et al. concluded in their analysis that the lubrication effect of the transmission system will directly affect the dynamic characteristics of the transmission system [8]. Guan Hao et al. used Romax software to perform optimization analysis of planetary gear modification, and compared and analyzed the vibration response and transmission error before and after modification [9]. Miryam B. Sánchez et al. determined the modification of spur gears through meshing stiffness, load distribution, and transmission error (including the type of modification curve, modification position, and modification amount), which has higher accuracy compared to the modification results obtained based on the latest meshing stiffness equation [10]. J. Bruyère et al. obtained the modification equations for spur and helical gears through numerical analysis, which can effectively control the transmission error, original stress, etc. of gears [11]. However, high gear tooth surface accuracy, large computational complexity, and relative complexity are required.
This article studies the lubrication characteristics of wind power gear transmission systems and conducts micro modification research on the tooth surface to address the phenomenon of eccentric load in spur gear transmission systems. Reasonable modification topology parameters are obtained, and various contact performance parameters before and after modification are compared and analyzed. To a certain extent, it can improve the contact characteristics of the tooth surface, improve the smoothness of the transmission system, reduce vibration noise, and extend the service life of the system.
2. Elastohydrodynamic lubrication model for gear line contact
2.1. Quasi static isothermal elastohydrodynamic lubrication equation
Gear meshing usually operates in an environment containing lubricating oil, so the meshing tooth surface is not in direct contact. There is a thin film of lubricating oil between the two tooth surfaces, which is called “elastohydrodynamic lubrication contact”. According to the Hertz contact theory, gear tooth meshing is considered as the contact between two parallel cylindrical axes, which are compressed against each other under the action of load without lubrication. The contact surface of the gear undergoes elastic deformation, and the actual contact area is not a line but a narrow surface, called the Hertz contact area, with its half width denoted as [12].
The calculation formula for the half width B of the Hertz contact zone:
where is the load per unit length; is the equivalent radius of curvature; is the equivalent elastic modulus, and , , and are the elastic modulus and Poisson’s ratio of the two gears, respectively.
In the Hertz contact area, the contact pressure is distributed in an elliptical pattern, namely:
where is the maximum Hertz pressure.
By linking Reynolds lubrication theory with Hertz contact theory, the film thickness formula for line contact elastohydrodynamic can be obtained. After considering lubrication, the lubricating oil undergoes a viscous pressure effect under pressure and the gear contact surface undergoes elastic deformation, as shown in Fig. 1.
Fig. 1Deformation diagram of gear oil film thickness
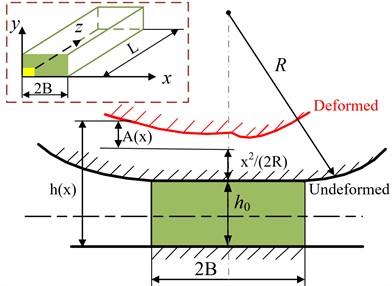
Fig. 1 shows that the coordinate system of oil film in the lubricating oil film. The -axis of the oil film coordinate system is the flow direction of the lubricating oil film, the -axis is the oil film thickness direction, and the -axis is the length direction of the oil film. The length of the oil film along the -axis of the oil film is , and the width of the oil film along the -axis is 2. The -coordinate of the oil film is much smaller than the other two coordinate values, and it can be simplified as a two-dimensional problem, which can be regarded as a line contact elastohydrodynamic lubrication state [13].
The elements of oil film are only affected by the fluid pressure and viscous force . The velocity of the element along the coordinate axis direction are , , and , respectively. And 0, 0. Then the steady-state isothermal Reynolds equation for line contact is:
where is the coordinate of the direction along which the lubricating oil film flows; is the density of lubricating oil; is the thickness of the lubricating oil; is the dynamic viscosity of the lubricating oil; is the oil film pressure; and are the entrainment velocity of the oil film in the -direction when 0 and , respectively.
When oil film is in a steady state, 0, , then:
In the actual working condition of elastohydrodynamic lubrication, the cylindrical surface often undergoes deformation in the normal direction which causing the shape of the gap is changed. Supposing the sum of the elastic deformations of the two surfaces along the normal direction is . Therefore, the formula for the oil film thickness at any point when the elastic cylinder contacts is:
where is the central film thickness without deformation; is the equivalent radius of curvature; is the elastic deformation displacement caused by pressure.
According to the theory of elasticity, the elastic displacement of each point on the surface in the vertical direction is:
where represents the distance between any line load and the coordinate origin; and are the starting and ending coordinates of load , respectively; is the equivalent elastic modulus; is an undetermined constant.
The density of lubricating oil is a function of pressure and temperature. When the pressure on the lubricating oil increases, its volume decreases, resulting in an increase in density. The change in density with pressure can be represented by the compression coefficient , which is:
where , , and are the volumes and pressures of lubricating oil with a mass of m at pressure and , and are the densities at pressures and , respectively. Therefore:
The formula for the compression coefficient k of lubricating oil is:
where , and are the dynamic viscosity under pressure and , respectively, and is the Reynolds viscosity coefficient.
The isothermal density equation is:
The is the pressure at the oil film, and the load per unit tooth width can be obtained by integrating, the formula is:
where is the coordinate of the entrance of the lubrication area; is the coordinate at the outlet of the lubrication area.
2.2. Numerical solution of elastohydrodynamic lubrication equation
In order to improve the stability and increase the convergence speed of the calculation process [14], the number of parameters is reduced by introducing dimensionless parameters. The formulas of dimensionless coordinates, pressure, oil film thickness, density, viscosity, material, velocity, and load are:
Dimensionless equation of line contact steady-state isothermal Reynolds is:
Dimensionless equations of oil film thickness equation, density equation, viscosity equation, load balance equation are:
Dimensionless Equations were resolved using a forward difference format and combine the Newton Raphson numerical calculation method and introducing a “downhill factor” to accelerate the convergence speed of the iterative process [15]. There are 264 nodes are selected. Calculate the domain boundary entry –2.5, boundary exit 1.5. After dispersing, the Reynolds equation, oil film thickness equation, viscous pressure equation, density equation, and load equation as follows:
Differentiate the above formulas to gain increment of each derivative matrix. Then these equations were solved by iteration until the convergence accuracy is met, with the oil film thickness convergence accuracy of 0.001 and a pressure convergence accuracy of 0.01.
3. Research on lubrication characteristics of transmission systems
3.1. Oil film thickness and pressure distribution at key meshing points of gear pairs
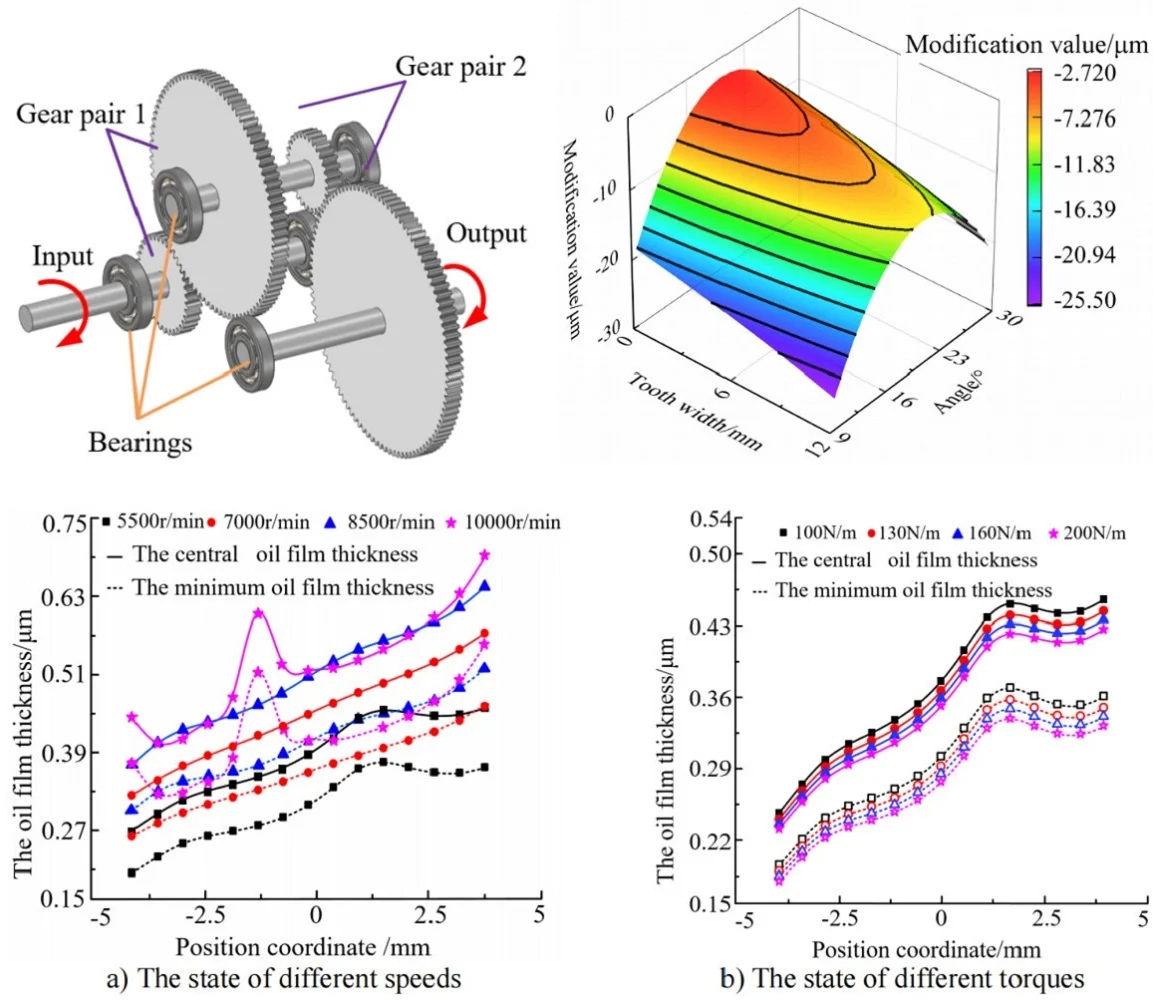
The two-stage parallel shaft spur gear transmission system of the DDS power transmission fault diagnosis platform which produced by SQI company. The transmission system consists of two-stage gear pairs, three transmission shafts and six deep groove ball bearings. The three-dimensional model and schematic diagram of two-stage gear transmission system is shown in Fig. 2. The parameters of transmission systems is shown in Table 1. During the transmission systems process, gears’ loads varies at different positions along the meshing line. So the load distribution is necessary. The coefficient of load distribution diagram along the meshing line of the gear without considering the transmission error as shown in Fig. 3. Therefore, the contact ratio of gear pair 1 is 1.7667 according Eq. (24). It shows the single tooth meshing time is relatively short. Moreover, the gear in the system has not been modified:
Fig. 2The three-dimensional model and schematic diagram of two-stage gear transmission system
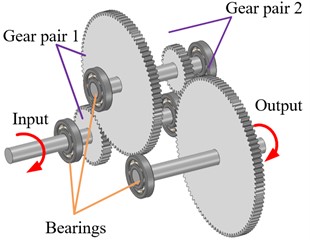
a) Three-dimensional model
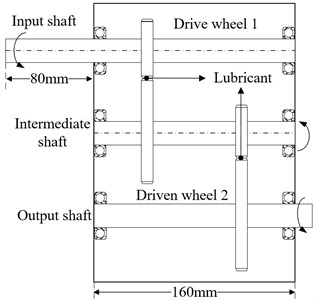
b) Schematic diagram
Table 1The parameters of transmission systems
Gear | The number of teeth | Module | Mesh angle / ° | The width of tooth | Mass / kg | Moment of inertia / kg∙m2 |
Driving gear of gear pair 1 | 36 | 1.5 | 20 | 12 | 0.16 | 2×10⁻⁴ |
Driven wheel of gear pair 1 | 90 | 1.5 | 20 | 12 | 1.3 | 3.04×10⁻³ |
Driving gear of gear pair 2 | 29 | 1.5 | 20 | 12 | 0.09 | 1×10⁻⁴ |
Driven wheel of gear pair 2 | 100 | 1.5 | 20 | 12 | 1.6 | 8.71×10⁻³ |
Fig. 3The coefficient of load distribution along the meshing line
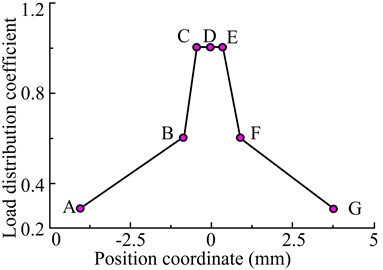
In the Fig. 3, point A and point G are the approach point and mesh-out point of double teeth-meshing, respectively. The point B and point F are the approach point and mesh-out point of single tooth-meshing, respectively. And the point D is the panel point. Based on the elastohydrodynamic lubrication model which was built, the oil film thickness and pressure distribution along the meshing position of the gear can be obtained by solving the elastohydrodynamic lubrication equation along the meshing line using the Newton method. Taking the transmission system’s gear pair 1 as the research object, when the speed of input shaft is 5500 r/min and the torque is 100 N·m, the profile of oil film pressure and oil film thickness at five key points (A, B, D, F, G) as shown in Fig. 4.
Fig. 4(a) is the oil film pressure profile of gear pair 1 along the meshing line. It shows that the second peak pressure of the meshing point F lags behind the point A, and the value is higher than the point A. The oil film pressure distribution of the double teeth-meshing approach point A is relatively stable, and its value is the smallest compared to the other four points. With the exception of point A and point G, every point are in the single tooth-meshing state and the loads are heavy which caused the oil film pressure distribution has significant fluctuations. So the oil film pressure’s value of point B, point D and point F is also higher than the rest.
Fig. 4(b) is the oil film thickness profile along the meshing line of gear pair 1. Point A is the double teeth-meshing approach point which means the process of gearing just start. So the shocking load and the entrainment velocity of point A are relatively small and therefore the oil film thickness at point A is the smallest. The load coefficients are the same of the approach point and the mesh-out point but of the oil film thickness. As the gear teeth gradually starts meshing, the curvature radius gradually increases resulting the oil film thickness gradually increasing along the meshing line because of the oil film thickness is positively correlated with the curvature radius. The amplitude fluctuation of oil film thickness at the single-teeth meshing point is also greater than that at the double-tooth meshing point, and the amplitude fluctuation of oil film thickness at the panel point D is significantly increased which is the key position of oil film fracture. It can also be seen that the maximum thickness of oil film is at the position of point G, which is due to sufficient lubricating oil supply and pile up effect at this point.
Fig. 4The coefficient of load distribution along the meshing line
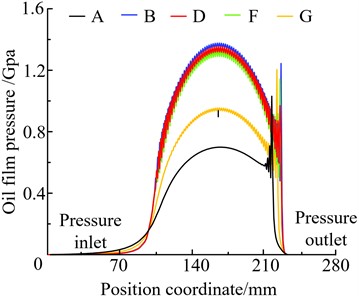
a) Oil film pressure profile
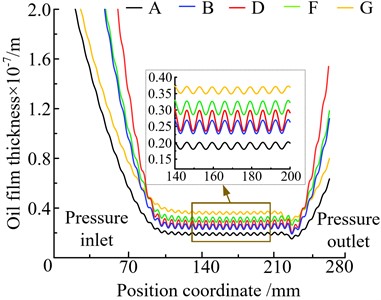
b) Oil film thickness profile
Examination of Fig. 4 reveals the trend of oil film pressure and thickness by theoretical arithmetic is feasible.
3.2. The influence of speed and load on the oil film thickness of gear pairs
The variation trends of oil film thickness of gear pairs under different speeds and torques are discussed to analyze the impact of different operating conditions on the lubrication characteristics of transmission system.
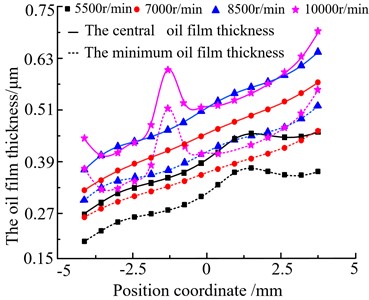
The variable trend graph of the minimum and central oil film thickness along the meshing line as shown in Fig. 5.
Fig. 5The coefficient of load distribution along the meshing line
a) The state of different speeds
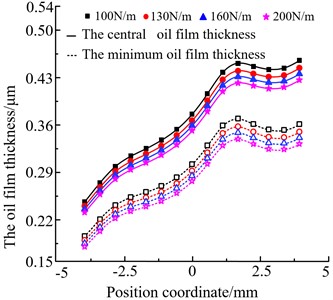
b) The state of different torques
Fig. 5(a) shows the oil film thickness of gear pair 1 along the meshing line under the same torque and different speeds conditions (torque: 100N·m, speed: 5500 r/min, 7000 r/min, 85000 r/min, and 10000 r/min). It can be seen that the minimum oil film thickness is smaller than the central oil film thickness, and oil film thickness not only gradually increase along the meshing line, but also gradually increase with increased speed as a whole. The oil film thickness increases sharply because of the dynamic load increased obviously with the meshing frequency to vibrate in resonance with natural frequency of transmission system when the speed is 10000 r/min.
Fig. 5(b) shows the oil film thickness of gear pair 1 along the meshing line under the same speed and different torques conditions (speed: 5500 r/min, torque:100 N·m, 130 N·m, 160 N·m, and 200 N·m). It shows that the minimum oil film thickness is smaller than the central oil film thickness along the meshing line, and oil film thickness gradually decrease with increased torque as a whole. It can also be seen that the change in torque has little effect on the oil film thickness at the teeth-meshing/tooth-meshing approach point. The principal reason for this regular is extreme pressure (EP) of oil. When the torque increased to a certain value, the distance between the oil film molecules decreases.
3.3. Simulation analysis of lubrication characteristics of transmission system
To verify the oil film thickness results obtained from the numerical analysis, this paper uses Romax designer software to analyze the lubrication performance of the wind turbine’s transmission system. And the rigid-flexible coupling model of the transmission system was built. In order to improve the efficiency of analysis, the model details were reasonably simplified while maintaining the original geometric parameters, material parameters, and spatial positional relationships.
The transmission system box is made of cast iron, with Young’s modulus of 1.25e5MPa, density of 7250 kg/m3 and Poisson’s ratio of 0.26. During the meshing process of the transmission system, the mesh size is 10 mm. The meshed model is shown in Fig. 6, including 420154 nodes and 271455 units. And set the bottom of the box as full constraint.
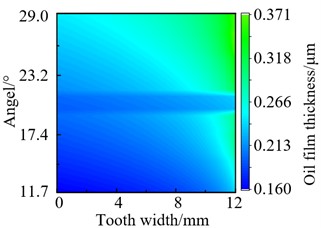
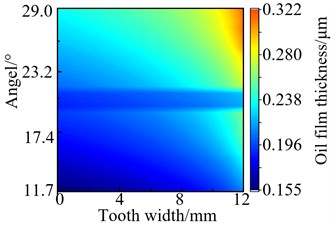
Throughput analysis, the profile of gear pair 1’s oil film thickness under the same torque and different speeds conditions (torque: 100 N·m, speed: 5500 r/min, 7000 r/min, 85000 r/min, and 10000 r/min) were obtained, as shown in Fig. 7.
It can be seen that the oil film thickness gradually increases along the meshing line. And the film thickness at the top of the teeth of the tooth-meshing approach point is a minimum, and the maximum oil film thickness at the root of the teeth of the teeth-meshing/tooth-meshing mesh-out point from Fig. 7. The thickness of the oil film gradually generally increases along the meshing line, and increases with the increase of the speed, but the increase amplitude shows a decreasing trend. Therefore, the results of simulation is consistent with the theoretical analysis.
Fig. 6The rigid-flexible coupling model of the transmission system
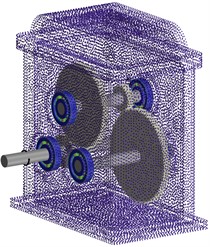
Fig. 7The profile of oil film thickness in the state of different speeds
a) 5500 r/min
b) 7000 r/min
c) 8500 r/min
d) 1000 r/min
From Fig. 7, it also can be seen that the minimum oil film thickness is relatively large near the right tooth surface, and the distribution along the tooth surface is not in an equal line pattern. This is due to the alternating occurrence of single and double teeth during the meshing process, the oil film thickness near the right tooth surface is relatively large. So the basic reason for this phenomenon is load deflecting which was caused by the transmission shaft inevitably undergoes bending deformation during the meshing process of the two-staged gear system.
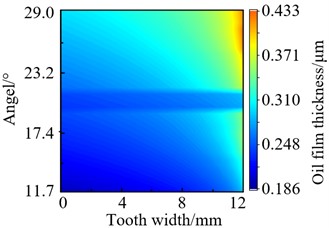
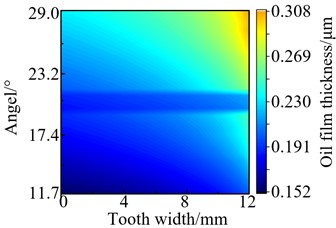
The profile of gear pair 1’s oil film thickness under the same speed and different torques conditions (speed: 5500 r/min, torque: 100 N·m, 130 N·m, 160 N·m and 200 N·m) were obtained, as shown in Fig. 8. In broad terms, the minimum oil film thickness is relatively large near the right tooth surface and increases with torque. But increasing the amplitude of the minimum oil film thickness gradually decreased with torque increased. This is because the lubricating oil itself has extreme pressure characteristics which cause the lubricating oil molecules are difficult to continue to compress when torque reaches a certain value.
Fig. 8The profile of oil film thickness in the state of different torques
a) 100 N·m
b) 130 N·m
c) 160 N·m
d) 200 N·m
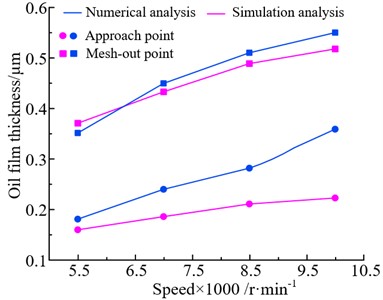
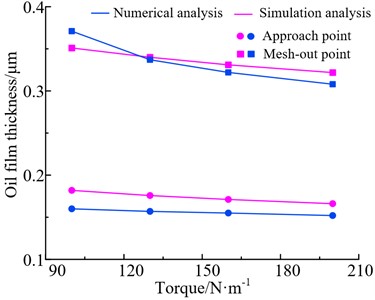
The numerical analysis and simulation analysis of the minimum oil film thickness at the approach point and the mesh-out point of the gear teeth under different working conditions are shown in Fig. 9.
Fig. 9 shows that the minimum oil film thickness increases with increasing the speed whereas decreases with increasing the torque. The results of numerical analysis and simulation analysis have the same trends at different operating conditions and show the least error. This is due to external factors such as node division accuracy and loading time of the finite element model in the simulation analysis can result in certain errors compared to theoretical analysis. However, the variation regular of oil film thickness of the gear pair 1 is consistent with the numerical analysis results under different conditions, verifying the correctness of the theoretical analysis.
Fig. 9The coefficient of load distribution along the meshing line
a) The state of different speeds
b) The state of different torques
The oil film thickness of mesh-out point is much greater than approach point whether the state of different speeds or different torques. The main reason is partial load phenomenon which eventually leads to lifetime of transmission system decreasing due to poor lubrication of the left tooth surface. Therefore, it is necessary to modify the Gear to improve this phenomenon.
4. Simulation analysis of lubrication characteristics of transmission system after modification
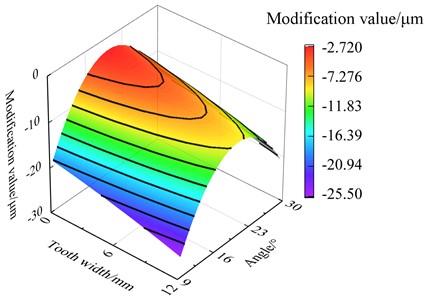
Based on the genetic algorithm, optimization variables and goals are regarded as evolving genome and fitness function of biological evolution to perform its flexibility evaluation. Low flexibility individual will be sifted out which rely on mechanisms, and high flexibility individual will generate the next generation which rely on gene recombination and mutation to. After enough algebra, individuals which close to the optimization goals can be obtained. The modification value for drum-shape, tooth inclination of tooth and involute can be obtained, which are 0.3621 μm, –5.96 μm, 13.28 μm, 5.44 μm, respectively. And the topology map topology of tooth surface after modification as shown in Fig. 10.
Fig. 10Topological map of tooth surface after modification
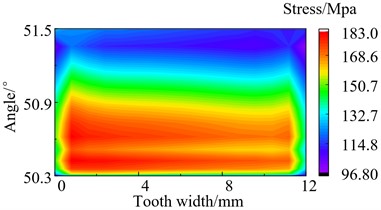
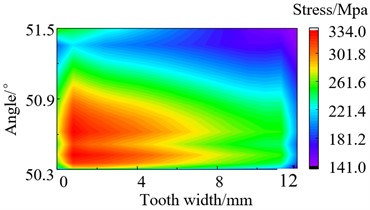
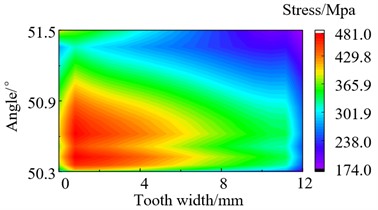
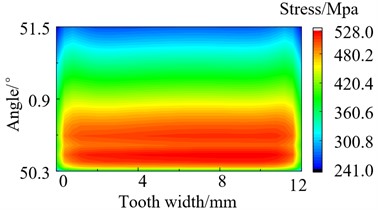
During the meshing process of the transmission system, there will be varying degrees of partial load phenomenon. This phenomenon can cause the stresses to concentrate on one side of the tooth surface. Excessive stress can cause the teeth to break and fail. Perform stress analysis on the tooth root of gear teeth after modification, and obtain the stress distribution diagram. The stress distribution of loaded tooth root before and after modification as shown in Fig. 11 and Fig. 12. It can be seen that the stress distribution at the tooth root after modification is relatively symmetrical and uniform overall. The max stress of the tooth root before and after modification is 481.0 MPa and 383.5 MPa separately when the torque is 700 N·m, which decreased by 20.7 % after modification. Through summarize the decrease of max stress in other three different operating conditions is 3.30 %, 17.81 % and 15.38 % respectively after modification. It can be seen that the modification effectively reduces the maximum stress of the tooth root.
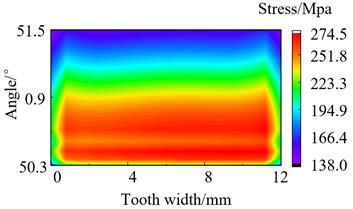
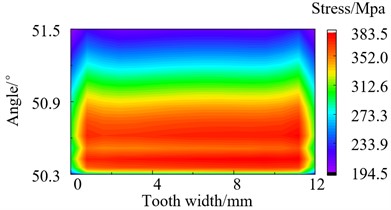
The distribution of unit load on tooth surface directly affects the contact performance of tooth surface. The load gradient sudden change and concentration of the tooth surface will directly impact on the smoothness of gear transmission. In an ideal state, it is better that the load gradient and concentration ratio are more small.
The distribution of unit load on the tooth surface after modification under different working conditions is shown in Fig. 13, and the maximum unit load on the tooth surface of the transmission gear before and after modification is compared, as shown in Table 2. It can be seen that the load of tooth face assumes a uniform distribution after modification. The max unit load on the tooth face before and after modification is 472.0 MPa and 347.0 MPa separately when the torque is 900 N·m, which decreased by 26.48 % after modification. Through summarize the decrease of the max unit load in other three different operating conditions is 9.37 %, 21.62 % and 25.14 % respectively after modification. It can be seen that the modification effectively reduces the peak load on the tooth face.
Fig. 11Stress distribution of loaded tooth root before modification
a) 5500 r/min-1
b) 7000 r/min-1
c) 8500 r/min-1
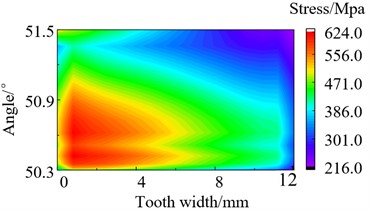
d) 1000 r/min-1
Fig. 12Stress distribution of loaded tooth root after modification
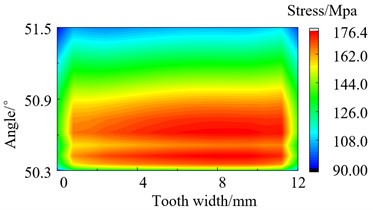
a) 100 N·m
b) 130 N·m
c) 160 N·m
d) 200 N·m
Table 2The maximum unit load of tooth surface / N·mm-1
Operating condition | Before modification | After modification | |
300 N·m | 182.6 | 176.4 | 3.40 % |
500 N·m | 334.0 | 274.5 | 17.81 % |
700 N·m | 481.0 | 383.5 | 20.27 % |
900 N·m | 624.0 | 528.0 | 15.38 % |
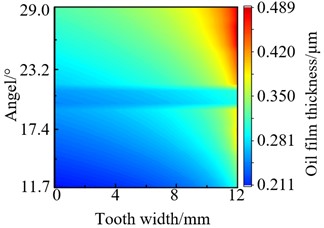
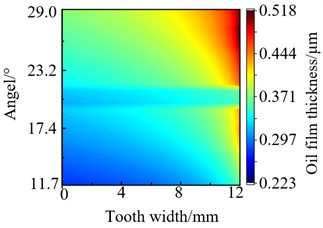
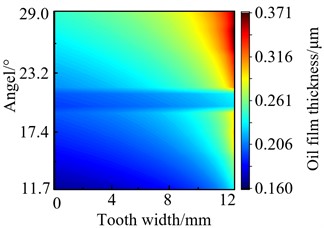
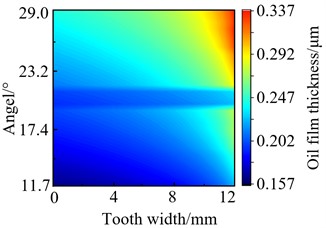
The distribution of oil film thickness will directly affect the quality of lubrication performance. After modification, the distribution of oil film thickness in different operating conditions are shown in Fig. 14.
Fig. 13The load distribution of modified tooth surface
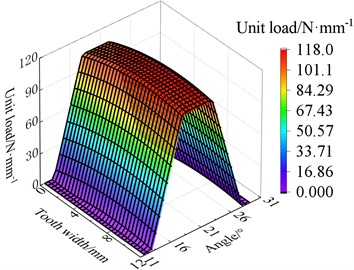
a) 300 N·m
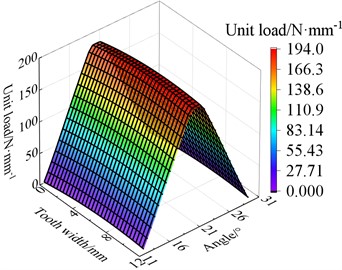
b) 500 N·m
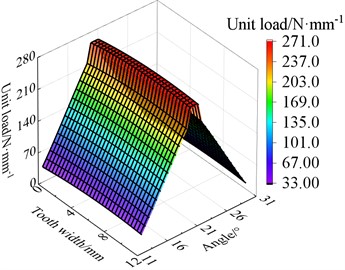
c) 700 N·m
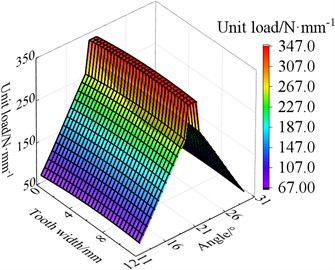
d) 900 N·m
Fig. 14The oil film thickness after modification
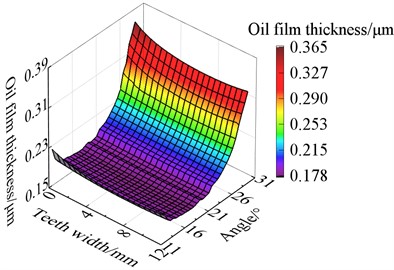
a) 300 N·m
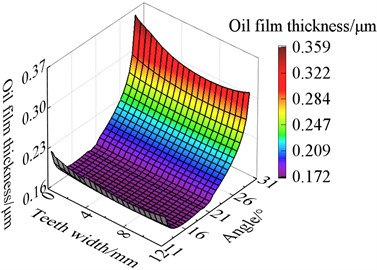
b) 500 N·m
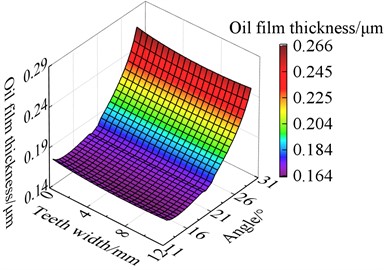
c) 700 N·m
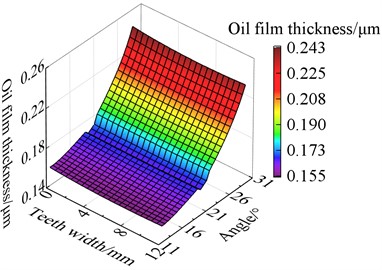
d) 900 N·m
From Fig. 14, it can be seen that at the top of the tooth, the oil film thickness is the highest in the entire region. The film thickness gradually decreases from the top of the tooth to the root of the tooth which shows a gradient distribution.
This is because the force at the root of the tooth is the largest, and the lubricating oil is squeezed out from the top of the tooth to the bottom of the tooth, resulting in a smaller thickness at the root of the tooth. It also can be seen that the oil film thickness is more uniform along the tooth width direction and the modification effect is better and more obvious with the increase of torque. The results indicate that modification can effectively reduce the partial load phenomenon and teeth wear to improve the lubricating performance and lifetime of gears.
5. Conclusions
1) A linear contact elastohydrodynamic lubrication model for transmission system was established. The oil film thickness and oil film pressure distribution at key points along the meshing line of the gear were obtained by using Newton iteration method. It was found that the oil film thickness gradually increases with the increase of speed and decreases with the increase of load.
2) A rigid flexible coupling model of the transmission system was established based on Romax software, and the variation regulars of oil film thickness on the tooth surface under different speed and torque conditions were analyzed, verifying the correctness of the numerical analysis. It was also found that the coupling deformation of the transmission system caused by partial load phenomenon, resulting in uneven distribution of oil film thickness along the tooth width direction.
3) Taking into account factors such as peak transmission error, load amplitude, and load distribution coefficient, genetic algorithm is used to study the micro modification of gears. Compared to before the modification, the max unit load on the tooth face of the gear transmission system has decreased by up to 26.48 %, and the maximum tooth root stress has decreased by up to 20.35 %, effectively reducing the partial load phenomenon and improving the lubricating performance and lifetime of gears.
References
-
H. J. Wang, “The research on the strength of planetary gear transmission with flexible pine,” (in Chinese), Chong Qing, China: Chongqing University, 2012.
-
K. A. Irena, H. G. Lemu, and Y. A. Kedir, “Effect of interference size on contact pressure distribution of railway wheel axle press fitting,” Designs, Vol. 7, No. 5, p. 119, Oct. 2023, https://doi.org/10.3390/designs7050119
-
J. Tao, A. Wen, Z. Liu, and S. Yu, “Lean lubrication of ultra large modulus open gear and rack pair: A case study of the gear-rack drive mechanism of the Chinese “Three Gorge Dam” ship lift,” Journal of Cleaner Production, Vol. 282, p. 124450, Feb. 2021, https://doi.org/10.1016/j.jclepro.2020.124450
-
P. Huang, “Numeicial Calculation Methods of Elastohydrodynamic Lubrication,” (in Chinese), Bei Jing: Tsinghua University Press, China, 2013.
-
H. P. Evans, R. W. Snidle, and K. J. Sharif, “Deterministic mixed lubrication modelling using roughness measurements in gear applications,” Tribology International, Vol. 42, No. 10, pp. 1406–1417, Oct. 2009, https://doi.org/10.1016/j.triboint.2009.05.025
-
S. Li and A. Kahraman, “A transient mixed elastohydrodynamic lubrication model for spur gear pairs,” Journal of Tribology, Vol. 132, No. 1, p. 01150, Jan. 2010, https://doi.org/10.1115/1.4000270
-
M. Liu, C. Zhu, H. Liu, H. Ding, and Z. Sun, “Effects of working conditions on TEHL performance of a helical gear pair with non-newtonian fluids,” Journal of Tribology, Vol. 136, No. 2, p. 02150, Apr. 2014, https://doi.org/10.1115/1.4026073
-
M. Ankouni, A. Lubrecht, and P. Velex, “Modelling of damping in lubricated line contacts – Applications to spur gear dynamic simulations,” Proceedings of the Institution of Mechanical Engineers, Part C: Journal of Mechanical Engineering Science, Vol. 230, No. 7-8, pp. 1222–1232, Jan. 2016, https://doi.org/10.1177/0954406216628898
-
H. Guan, J. X. Wang, Z. Shi, and B. Yu, “Tooth profile modification of filtering gear reducer research based on Romax Software,” (in Chinese), Machine Design and Research, Vol. 29, No. 3, pp. 28–31, 2013.
-
M. B. Sánchez, M. Pleguezuelos, and J. I. Pedrero, “Influence of profile modifications on meshing stiffness, load sharing, and trasnsmission error of involute spur gears,” Mechanism and Machine Theory, Vol. 139, pp. 506–525, Sep. 2019, https://doi.org/10.1016/j.mechmachtheory.2019.05.014
-
J. Bruyère and P. Velex, “A simplified multi-objective analysis of optimum profile modifications in spur and helical gears,” Mechanism and Machine Theory, Vol. 80, pp. 70–83, Oct. 2014, https://doi.org/10.1016/j.mechmachtheory.2014.04.015
-
J. Yang, T. Lin, Z. He, and M. Chen, “Novel calculation method for dynamic excitation of modified double-helical gear transmission,” Mechanism and Machine Theory, Vol. 167, p. 104467, Jan. 2022, https://doi.org/10.1016/j.mechmachtheory.2021.104467
-
Z. L. Xiao, “Oil film model and parameters analysis for modified spur gear based on elastohydrodynamic lubrication,” (in Chinese), Chang Sha, China: Hunan University, 2017.
-
Y. Peng, N. Zhao, M. Zhang, W. Li, and R. Zhou, “Non-Newtonian thermal elastohydrodynamic simulation of helical gears considering modification and misalignment,” Tribology International, Vol. 124, pp. 46–60, Aug. 2018, https://doi.org/10.1016/j.triboint.2018.03.025
-
L. P. Yang, “Elastohydrodynamic lubrication and its application in gear transmission,” (in Chinese), Tai Yuan, China: Taiyuan University of Technology, 2002.
About this article

This work supported by Research Program supported by the Doctoral Program of Tianchi (tcbs201924), the Talent Youth Doctoral Program of Youth Doctoral (51052300553) and the Xinjiang University scientific research fund (BS190220).
The datasets generated during and/or analyzed during the current study are available from the corresponding author on reasonable request.
Li Cao: conceptualization, data curation, methodology, project administration, resources, supervision, visualization, writing-original draft preparation, writing-review and editing. Wenlei Sun: conceptualization, funding acquisition, project administration, software. Tao Gou: data curation, formal analysis, investigation, validation, visualization, writing-original draft preparation.
The authors declare that they have no conflict of interest.
