Abstract
One of the primary sources of noise and vibration in automobiles is gearboxes. Shafts, gears, and bearings are the main causes of noise and vibration in vehicle gearboxes. Various studies have reported that vibrations’ root cause is bearing excitation. Besides bearing fatal defects or extreme structure resonance amplification, gear mesh is the primary source of high-frequency vibration and noise, even in newly built units. Gear damage detection is frequently crucial in automotive gearboxes and vehicle safety. Furthermore, vibrations caused by shaft imbalances, shaft misalignments, and other factors can cause noise and vibrations in the drivetrain's transfer path. In addition, the vibration of an automobile gearbox is closely related to poor design, construction quality, and production accuracy. This paper reviewed previous research and methods on car gearboxes for conventional vehicles. It was obvious that frequency analysis and order analysis were commonly used in noise and vibration analysis on car gearboxes. Envelope analysis is usually used to analyze bearing faults. Finally, rolling-element bearing diagnostic techniques were also reviewed.
Highlights
- The excitation of the shafts, gear meshes, and bearings are the primary causes of noise and vibration in the automobile gearbox.
- A review of methods for detecting and localizing noise and vibration sources in the car gearbox has been summarized.
- Frequency analysis and order analysis are commonly used in noise and vibration analysis in the car gearbox.
- Envelope analysis is usually used to analyze bearing faults.
1. Introduction
Vehicle noise and vibration is one of the essential attributes which must be considered attentively in the design process. This attribute must be used for the product development process. Automobile manufacturers try to impress customers with their design, reliability, safety, low fuel consumption, and the highest possible quality and comfort of their cars [1]. A pleasant vehicle interior noise is a key attribute of customer's purchase decisions [2]. Therefore, quality and comfort are often the last and decisive influences that will cause a successful or unsuccessful sale.
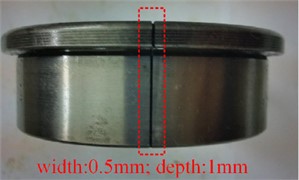
Fig. 1Development of automobile noise emission limits over the years [3]
![Development of automobile noise emission limits over the years [3]](https://static-01.extrica.com/articles/23888/23888-img1.jpg)
By issuing requirements for the maximum noise level of vital noise resources, several authorities aim to reduce the amount of noise in the environment. Regulations about noise emissions are mostly applied to motor vehicles. Newly produced cars are not allowed to drive on public roads if their noise levels are higher than predetermined thresholds. Thus, manufacturers of automobiles have had enough time to incorporate advancements in noise reduction. Fig. 1 shows the timeline for noise limits for passenger cars and heavy trucks with an engine power of 150 kW. In 1985, it was indicated that the measuring procedure was changed in the EU. For heavy trucks, noise reduction corresponded to 2 dB to 4 dB of stricter requirements, while for passenger cars, it corresponded to approximately 2 dB of less stringent requirements.
The gearbox is a source of vibration, which consequently leads to noise. Shafts, gears, and bearings are the primary causes of noise and vibration in vehicle gearboxes. Numerous investigations have revealed that bearing excitation is the primary source of vibrations [3]. Besides bearing fatal defects, gears are the main sources of high-frequency vibration and noise, even in newly built units. Gear damage detection is frequently crucial in automotive gearboxes and power drive trains and can improve industry and vehicle safety [4].
The driveline is one of the major sources of noise and vibration that excites the vehicle structures across a wide band of frequencies in commercial vehicles [5]. Gearboxes use geartrains to manage the torque and speed of drivetrains. However, they fail more often than other drivetrain components. Gearbox failure can lead to catastrophic failures, significant financial losses, malfunctions, and machine shutdowns. Consequently, gearbox health monitoring and fault diagnostics are becoming essential [6].
The parameter employed to assess drive smoothness is the Transmission Error (TE) [7]. The main factors influencing gearbox noise and vibration are the teeth meshing and shaft revolution frequencies and the harmonics and sideband components that correspond to these frequencies. One of the most crucial and essential ideas to comprehend the vibration of gears is that the TE generates the portion of the tooth meshing frequency that influences the gear's vibration [8]. Reducing the gearbox’s TE lowers the gearbox’s vibration and noise levels. Inaccuracies in manufacturing and design can also lead to transmission errors. TE is, therefore, a crucial factor to consider when designing significant gears. One way to further reduce gear noise is to optimize the geometry to minimize TE, reducing vibration and noise [9].
According to the mentioned issue, vehicle noise and vibration reduction are necessary in the car gearbox. M. S. Qatu summarized recent research in the general area of NVH with an emphasis in the automotive field [10]. Qatu et al. reviewed some of the recent literature in the field of automotive NVH [11]. Panza reviewed the main experimental techniques adopted for the measurement and analysis of noise and vibration in a commercial vehicle [12]. Aherwar and Khalid briefly reviewed of some current vibration based techniques used for condition monitoring in geared transmission systems [13]. Bharadwaj et al. reviewed various NVH sources of combustion engines [14]. Khan and Burdzik reviewed techniques, case studies, and future directions on measurement and analysis of transport noise and vibration [15]. However, a review of methods of detection and localization of the sources of noise and vibration on car gearboxes remains limited and still needs to be improved. This paper reviewed previous research and methods on car gearboxes in terms of noise and vibration analysis for conventional vehicles. Finally, rolling element bearing diagnostic techniques were reviewed.
2. Automotive gearbox
Automotive transmissions are vital in any vehicle, enabling efficient power transfer from the engine to the driven wheels. Transmissions can be divided into several basic types: manual, automatic, sequential, and continuously variable (CVT). The vibrations of automotive transmissions are usually caused by their mechanical nature, the meshing of the gears, and the interaction with other components of the drive system. These vibrations are a natural by-product of mechanical operations but can be more pronounced due to misalignment, manufacturing defects, or general wear and tear over time. Effectiveness is closely related to these vibrations. Ideally, the transmission should transfer the engine’s mechanical power to the wheels with minimal energy losses. However, vibration leads to the dissipation of energy in the form of heat and sound, reducing the overall efficiency of the transmission. According to the above division and efficiency of transmissions published in [16], manual gearboxes in passenger cars achieve 92-97 %, automatic gearboxes 90-95 %, and gearless gearboxes 70-86 %. However, in some cases where the efficiency of a special single-speed gearbox has been investigated, even significantly lower values have been achieved, averaging 50 % depending on the driving cycle [17]. Fig. 2 shows the cutaway view of a manual transmission gearbox.
Fig. 2Cutaway view of a manual transmission gearbox [18]
![Cutaway view of a manual transmission gearbox [18]](https://static-01.extrica.com/articles/23888/23888-img2.jpg)
2.1. Previous research of manual transmission gearbox in field of noise and vibration
In 2009, Tuma studied gearbox noise and vibration prediction and control [19]. The research on lowering truck gearbox noise was examined. The time and frequency methods provide the foundation for gearbox noise and vibration analysis. The transmission error measurement can be used to test the accuracy and design of the gears. The impact of the most effective modifications in lowering noise caused by gears was also examined. Enough rigid housing, shafts, gears, HCR gears, and tooth surface modification for design load are necessary for a low-noise gearbox. Introducing HCR gears will have varying positive effects depending on the gear quality class. Grinding-finished gears are required.
In 2014, Tomeh identified the sources of vibration and noise in the car gearbox by spectral analysis [20]. The findings demonstrate that the vibration spectra were used to determine the damage state of an inner ring of a pinion that was mounted in “glasses”. The gearbox vibration measurement is not restricted to the previously mentioned diagnostic. Other techniques based on vibration monitoring can be applied to search for and identify damage sources during construction, placement, modification, or alteration of technical parameters.
In 2014, Praveenkumar et al studied fault diagnosis of automobile gearbox based on machine learning techniques [21]. Four gears' classification efficiencies were quoted after the efficiency of good and defective gear was classified under two distinct speed and load situations. It was discovered that the Support Vector Machine may be utilized for automated fault diagnosis and exhibits superior classification capacity in identifying different gearbox faults.
In 2016, K. He et al. conducted experimental study of the vibration characteristics of the fault cylindrical roller bearing of special vehicle gearbox [22]. It was discovered that four time-domain parameter indicators – RMS, STD, crest factor, and kurtosis – that are easy to calculate and apply to online bearing monitoring can be utilized for a thorough assessment of whether the fault happened effectively. However, the four time-domain parameter indicators are unable to identify the kinds of cylindrical roller bearing faults or the extent of those problems. Thus, vibration signals must be analyzed using frequency domain techniques to diagnose cylindrical roller bearing faults.
In 2017, Tomeh studied the possibilities for reducing car gearbox vibration and noise [23]. The outcome demonstrates that the examination of spectral envelopes on a pinion with a diameter of 32h5, which functions as the inner ring of the bearing, has the greatest impact on reducing the total vibration levels in a gearbox. It was lowered on average by 86 %. Additionally, based on the stand, it was observed that the noise level on the super-finished pinion was decreased by as much as 15 dB in certain orders. These factors make it reasonable to conclude that superfinishing significantly reduces the overall noise produced by automobile gearboxes.
In 2017, Oudrnický and Tomeh studied the noise level of reverse motion gearing of gearbox. The results show that the reverse speed degree produces a high noise level of reverse motion gearing of the gearbox [24].
In 2017, Widodo et al. studied fault detection of gearbox using time-frequency method [25]. It was discovered that the distribution of vibration amplitudes toward its frequencies can be displayed using a Short-Time Fourier Transform (STFT). Nevertheless, the STFT approach is unable to pinpoint the site of gear defects. Based on the shaft's rotational angle and the frequency change that occurs when the rotation angle intersects with a fault, Time Synchronous Averaging (TSA) and Continuous Wavelet Transform (CWT) can be used to locate faults relative to one another. Cepstrum analysis's ability to display peaks that correspond to defects in a particular quefrency domain makes it useful for detecting gear problems. Nevertheless, the relative location of gear failures cannot be ascertained using this method.
In 2019, Alshammari et al. studied fault diagnosis of helical gear through various vibration techniques in automotive gearbox [26]. It was shown that the time domain offers helpful data for analyzing gearbox faults. From the time domain approach, the crest factor, RMS, and kurtosis for both defect and normal gearboxes are derived. When compared to a normal gear, the fault gear's high signal increases. In tooth breakage gear, all parameters have values that are higher than in regular gear. Every parameter increases as the breakage gear’s speed increases. While the time domain is unsuitable for fault monitoring, RMS, crest factor, and kurtosis ratios for acceleration response are appropriate during defect faults. Faster shaft speeds tend to result in larger RMS magnitude, crest factor, and kurtosis ratios for both defective and normal gears.
In 2019, Barbieri et al. studied the analysis of automotive gearbox faults using vibration signal [27]. It was discovered that there were notable discrepancies between the reference and damaged gearboxes in the indices produced using wavelet transform and mathematical morphology. In this instance, the signals from the damaged samples were higher than the reference signals. Furthermore, compared to other indexes examined and used in the time domain, it was shown that the indexes derived by mathematical morphology exhibited higher stability in the outcomes.
In 2019, Tomeh studied an influence of the load on the car gearbox noise [28]. The findings demonstrate that all three measuring techniques – running conditions at the device stand, test stand, and actual traffic – confirmed that vibration and noise levels decreased as loading increased.
In 2021, Bhavi et al. studied early detection of failure of spiral bevel gears used in differential gearbox [29]. It was discovered that early identification of spiral bevel gear pair failure during operation could be achieved by on-board noise and vibration measurement, as well as by examining the noise and vibration spectrum condition monitoring and fault diagnostics of the specified differential gearbox.
In 2022, Sann and Tomeh studied the detection and localization of the sources of vibration and noise on the car gearbox using frequency analysis [30]. It was found that the reasons for the increased noise and vibration of the car gearbox are the misalignment of the input shaft, the increased value of the differential imbalance, and clearance between the driving and driven gear teeth.
In 2022, Z. Shen et al. studied vibration fault detection of vehicle transmission gearbox based on time-frequency analysis of non-stationary signals [31]. Based on the amplitude and phase modulation of the fault signal, experimental findings demonstrate the high detection accuracy and high detection rate of the time-frequency analysis.
In 2023, Singha et al studied faulty voice diagnosis of automotive gearbox based on acoustic feature extraction and classification technique [32]. It was discovered that the Mel-frequency cepstrum coefficients (MFCC) and their derivatives, the ∆MFCC and ∆∆ MFCC feature extraction technique, are used to determine the acoustic features. Support vector machine (SVM), decision tree (DT), linear decrement analysis (LDA), Naive Bayes (NB), and logarithm regression (LR) classifiers are used to select the best statistical characteristics. The best classification result is obtained for SVM and NB, the two classifiers discussed above. The faulty component was located using features-based classifier techniques.
delta-ANALYSER is an equipment used for condition monitoring of vehicle powertrain. The early-stage damage detection based on vibration allows very precise prediction of failures and saves expensive prototypes from getting destroyed. The delta-ANALYSER processes data from the acceleration sensors combined with data of the revolution counters. A spectrum is calculated via Fast Fourier Transformation (FFT) from the measured signal of the structure-born noise. Frequency analysis and order analysis are used in evaluation methods [33]. delta-ANALYSER provides three software. First, delta-ANALYSER Run is the setting and monitoring software. It is used to control and run the measuring device. It enables creating and editing load steps, as well as starting and stopping the monitoring. The second module is the evaluation software delta-Evaluation.NET [34]. It is used to analyze and evaluate the measured data. It offers special tools, for example, the waterfall chart. Because of this separation, it is possible to analyze a test run at the office PC whilst another test is already running again. Third, rhf-OrderCalculator (ROC) is possible to calculate each component of a test item and show essential orders [35].
KISSsoft AG develops calculation programs for machine elements and gear design. The focus is gearbox calculations, including shafts, bearings, gears, etc. Time domain and frequency domain analyses are used in noise and vibration analysis of gearboxes [36].
2.2. Automotive gearbox noise sources
A gearbox is a mechanical device that repeats its power transfer cycle periodically. It can be exactly mathematically stated and has concrete constructional components. Periodic operation yields noise because of periodic vibrational manifestation. The sources of vibration and noise are rolling bearings, which act as a parametric source of vibration and noise, the gearbox housing, which is the surface from which acoustic energy is emitted, and the rotors because of residual imbalance [37].
The gearbox's primary source of noise and vibration is the gearing. The gearing's vibration and noise level are mostly determined by gear meshing parameters, including transmission error, edge tooth-bearing, gradient of change in the applied engagement force, gear contact ratio, and meshing stiffness variation [37]. The well-audible modulation effects cause harmonics of the base tooth meshing frequency and their sidebands. The noise and vibration of the geared axis systems originate from parametric self-excitation due to the time variation of tooth-contact stiffness in the mesh cycle, the inaccuracy of the meshing gears, and non-uniform load and rotational speed [38].
Ghost components or strange components are caused by errors in the teeth of the index wheel of the gear-cutting machine, particularly gear grinding machines employing the continuous shift grinding method, causing high-frequency noise because of the large number of index wheel teeth. These ghost components vanish after running in [39].
2.3. Typical defects of car gearbox components
The gearbox, a critical part of the transmission system, is subjected to considerable stress over time. Faults in such stressed mechanical components can lead to severe problems. Understanding common weaknesses can help with early diagnosis and maintenance. Here are some typical defects that occur in automotive transmission components [13].
2.3.1. Gears
Gears are defined as toothed members transmitting rotary motion from one shaft to another [40]. Over time, the teeth of the gears can wear down due to constant friction. This wear can lead to improper gear meshing, resulting in noise, vibrations, and inefficiency in power transmission. The most common gear defects in automotive gearboxes include splines, face wear, tooth breakage, pitting, and root cracks [41]. Surface fatigue, specifically notch, and pitting defects, are common failure modes of gears [42], as shown in Fig. 3.
Fig. 3Spalling and destructive pitting at one end of tooth at the pitch line [43]
![Spalling and destructive pitting at one end of tooth at the pitch line [43]](https://static-01.extrica.com/articles/23888/23888-img3.jpg)
2.3.2. Bearings
Bearings are produced to take pure radial loads, pure thrust loads, or a combination of the two loads [44]. Fig. 4 shows the terminology of a ball bearing. The four essential parts of a bearing are the outer ring, the inner ring, the balls or rolling elements, and the separator or cage.
Fig. 4Terminology of a ball bearing [44]
![Terminology of a ball bearing [44]](https://static-01.extrica.com/articles/23888/23888-img4.jpg)
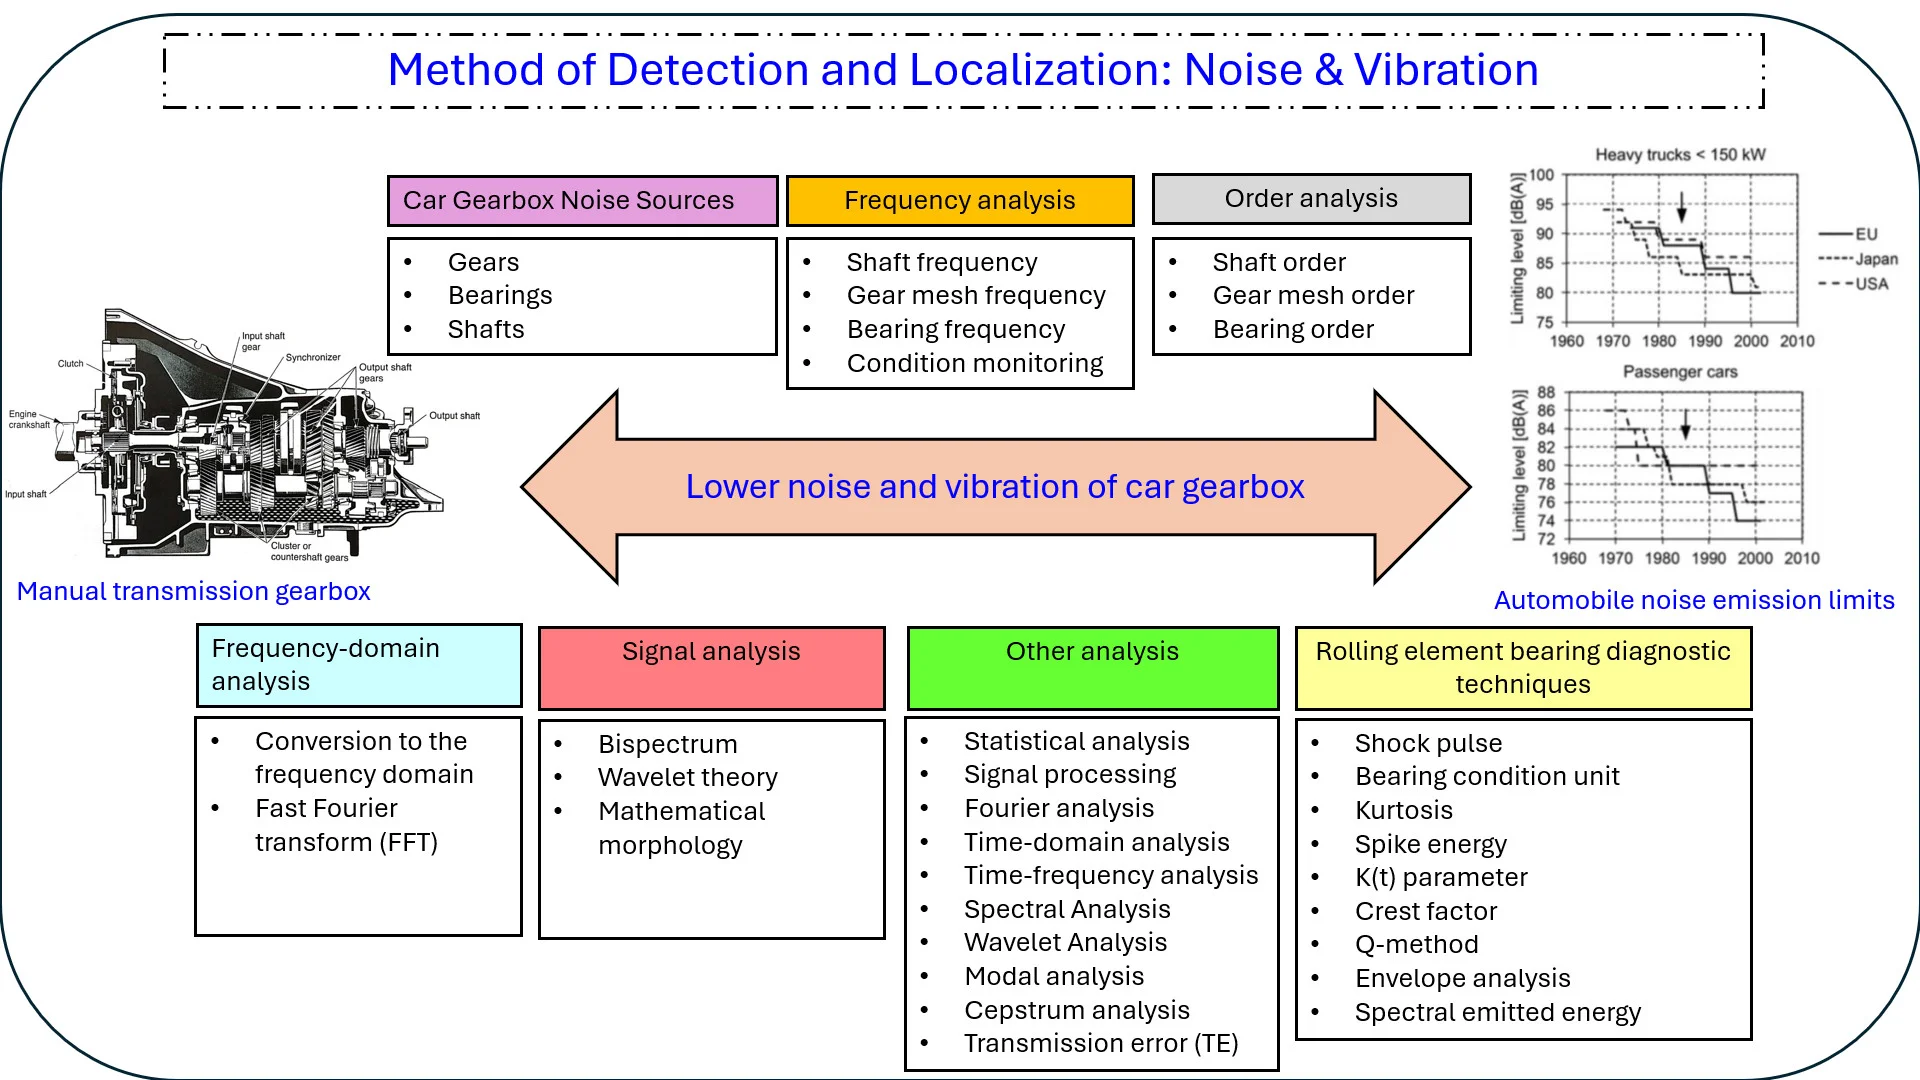
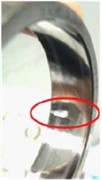
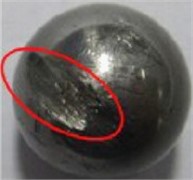
Gearbox-bearing defects are a significant concern in various industrial fields. Bearings facilitate the smooth running of the gears. Over time, bearings can wear out, leading to noise and rough running. Bearings can cause the gears to work out of balance, increasing wear. The most common defects in gearbox bearings include inner race faults, white structure flaking (WSF), white etching cracks (WEC), and failures in planetary and high-speed shaft (HSS) bearings. Inner race faults in bearing suspension are a common fault in induction motors coupled with a gearbox, and their detection can be done through vibration monitoring of characteristic bearing frequencies. WSF and WECs are prevalent failure modes in gearbox-bearing raceways, leading to microstructural changes and axial cracks. WECs are also known as white-structured flaking and can result in premature bearing failure [45], [46]. Fig. 5 shows the typical bearing faults.
2.3.3. Shafts
Shaft breakage is one of the most catastrophic failures in any transmission system that can ultimately lead to significant financial loss [49]. The most common defects in gearbox shafts include misalignment, dents, pitting, and fatigue failures caused by stress concentration, as shown in Fig. 6. Insufficient machine chassis rigidity can misalign the gearbox and generator shafts. Gears can fail when the working stress exceeds the maximum allowable pressure, causing notching and pitting.
Fig. 5Typical bearing faults
a) Outer race fault [47]
b) Ball fault [47]
c) Inner race fault [48]
Fig. 6Fractured shaft [49]
![Fractured shaft [49]](https://static-01.extrica.com/articles/23888/23888-img8.jpg)
2.3.4. Synchronous rings
In manual gearboxes, the synchronization mechanism synchronizes the gear wheel's speed with the shaft's speed, allowing smooth gear changes. Faults in the synchronization can lead to grinding noises during shifting and difficulty in shifting. The most common defects of gearbox synchronous rings include tooth cracks, wear, plastic flow, and spelling.
The key component of dual-clutch, automatic, and manual transmissions is the synchronizer. During gear shifts, the synchronizers match the target gear’s speed. The downsized high-power density engine elaborates on greater angular accelerations. Increased angular acceleration shortens the synchronizers’ lifespan by causing torsional vibrations. Due to torsional vibration, the synchronizer rings can move freely in the available space. Higher angular acceleration synchronizers wear out through collisions with neighboring components. The carbon liner of the synchronizer wears down to zero wear gap. Gear clashes are caused by the zero-wear gap, which hampers synchronizer functionality [50], as shown in Fig. 7.
Fig. 7Synchronizer with a) nominal wear gap, and b) with zero wear gap [50]
![Synchronizer with a) nominal wear gap, and b) with zero wear gap [50]](https://static-01.extrica.com/articles/23888/23888-img9.jpg)
a)
![Synchronizer with a) nominal wear gap, and b) with zero wear gap [50]](https://static-01.extrica.com/articles/23888/23888-img10.jpg)
b)
2.4. Frequency analysis
Frequency analysis is a key method used in the diagnosis and maintenance of mechanical gearboxes. This technique is based on the principle that each gearbox component, such as gears, bearings, and shafts, has characteristic vibration frequencies that change when defective or worn. In frequency analysis, vibrations or sound signals from the gearbox are recorded and analyzed using spectrum analysis. In this way, specific frequency patterns corresponding to certain types of defects can be identified, such as gear cracks, bearing damage, or shaft imbalance. The advantage of this method is the ability to detect problems at an early stage, which allows maintenance or repairs to be carried out before more serious damage or equipment failure occurs. This makes frequency analysis an invaluable tool for ensuring the long-term reliability and efficiency of mechanical transmissions.
A complex waveform can be broken down into various frequency components via frequency analysis. It offers details on the frequency composition of vibration and noise. However, it is limited to vibration and noise's amplitude and temporal features. Time and frequency resolution may need to be traded off as a result. Eq. (1) is used in frequency analysis [15]:
where is time domain signal, and is mother or basis equation.
A contemporary method for locating the mechanical defects influencing the gearbox noise level, assembly quality, and overall quality of production in automobiles is frequency analysis of vibration spectra. Vibration spectrum analysis is carried out by technical diagnostics, which monitor the impact of gears, rolling element bearings in a complicated gearbox, and frequency analysis techniques [23]. The main excitation sources whose frequency can be calculated are rotor frequency, gear mesh frequency, and bearing frequency.
2.4.1. Rotor frequency or shaft frequency
Rotor frequency, a key factor in the diagnosis and condition monitoring of mechanical transmissions, is the rotor’s rotation frequency. This frequency is expressed in hertz (Hz) and is derived from the rotor's revolutions per minute (RPM). Rotation frequency was related to the rotating speed of the shaft [51].
The importance of the rotor frequency lies in its influence on the dynamics of the gearbox. Every part of the gearbox, including the teeth, bearings, and shafts, is subject to forces and vibrations directly affected by the rotor's rotation frequency. Abnormal vibration or increased noise may indicate problems such as wear, tooth damage, or shaft instability. These problems usually manifest themselves in specific frequency bands that can be identified through vibration spectrum analysis.
Fundamental harmonic components [52] correspond to the excitation frequencies of the machine components as expressed in Eq. (2):
where is speed in , 1, 2, 3, 4, 5,…, are speed degree of car gearbox, I, II, III represent shafts of gearbox as shown in Fig. 8, and is rotor frequency in [Hz]:
– Harmonic components:
– Subharmonic components:
– Interharmonic components:
Fig. 8Example of kinematic scheme of five-speed car gearbox [30]
![Example of kinematic scheme of five-speed car gearbox [30]](https://static-01.extrica.com/articles/23888/23888-img11.jpg)
2.4.2. Gear mesh frequency (GMF) or tooth frequency
Gear mesh frequency refers to the frequency at which the teeth of two gears come into contact with each other during rotation. The gear mesh frequency plays a crucial role in diagnosing problems in rotating machinery and can be used for fault diagnosis and research in gearboxes. The order spectrum of a gearbox vibration contains a component that is denoted by GMF, which is calculated as the product of the number of teeth and the frequency of rotation of the gear [3].
The gear mesh frequencies [51], [52] for every speed can be calculated by using Eq. (3):
where is the number of gear teeth, 1, 2, 3, 4, 5,…, are speed degree of car gearbox, I, II, III represent shafts of gearbox as shown in Fig. 8, and is rotor frequency in [Hz].
– Harmonic components:
– Subharmonic components:
– Interharmonic components:
2.4.3. Bearing frequency
The system’s initial energy balance will be disrupted by rolling bearing failure, and abnormal vibration is the most intuitive performance. The vibration signal associated with a bearing defect exhibits an increase or fluctuation in amplitude in the time domain and prominent amplitude in the frequency domain along the fault characteristic spectrum lines [53]. Different frequencies are obtained for flaws in an outer race, inner race, balls, and cage.
To calculate the frequency of inner ring, bearing cage, outer ring, and rolling elements, the following Eqs. (4) to (7) can be used. To calculate these frequencies, [54-56], the rotational speed and the inner dimensions of the bearing need to be known as shown in Fig. 9.
Frequency of inner ring or Ball-Pass Frequency Inner (Race) (BPFI):
Frequency of bearing cage or Fundamental Train Frequency (FTF):
Frequency of outer ring or Ball-Pass Frequency Outer (Race) (BPFO):
Frequency of rolling elements or Ball-Spin/Roller Frequency (BSF):
where is number of rolling elements, is rotor frequency, is outside diameter, is inner diameter, is pitch diameter, is diameter of rolling elements, is contact angle, and – value can be obtained from the specification of the bearings.
Fig. 9Inner dimensions of the rolling bearing [52]
![Inner dimensions of the rolling bearing [52]](https://static-01.extrica.com/articles/23888/23888-img12.jpg)
2.4.4. Modulation and sidebands
It is common for the symmetric components to have differing amplitudes with respect to the carrier component [3]. The phase shift between the phase modulation signal and the amplitude modulation signal determines the amplitude difference. The amplitudes of the symmetrical components are the same if both modulation signals are in phase. The mentioned amplitudes in the sidebands are different when there is a phase shift, or out of phase, between the amplitude modulation signal and the phase modulation signal. Theoretically, phase modulation can result in an infinite number of sideband components. However, only one upper and one lower sideband component is indicated in Fig. 10 for simplicity.
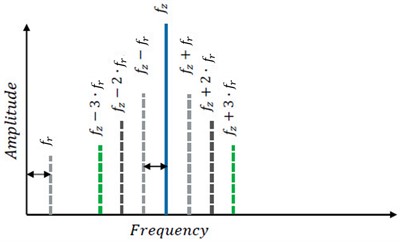
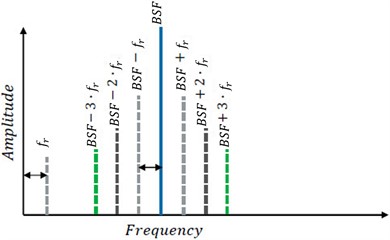
Modulation is the change of characteristic frequencies of gears and bearings due to shaft rotational frequencies. Modulation can also be generated by higher harmonics of shaft rotational frequencies. Modulation can be above, or below characteristic frequencies called sidebands. Generally, the higher frequency takes over the carrier frequency; the lower frequency takes over sidebands. For transmission gear mesh, the carrier frequency is the gear mesh frequency where the sidebands have the distance of the shaft frequency, which modulates the gear mesh as shown in Fig. 11(a). For bearings, the carrier frequency is the ball-spin/roller frequency, where sidebands have the distance of the shaft frequency, as indicated in Fig. 11(b).
2.4.5. Condition monitoring
Condition monitoring systems based on vibration analysis can monitor all parts of gearboxes, for instance, shafts, gears, and bearings [57]. Raw signals emitted from machines are the time waveforms and the phase reference. Different devices can be used to acquire signals. Different processing techniques can be used for further analysis of the frequency spectrum. With vibration analysis, various defects can be detected, such as bent shafts, eccentricity, gear defects, bearing defects, electrical faults, oil whirl, cavitation, resonance, etc.
Fig. 10Sideband components of the amplitude and phase modulated signal [3]
![Sideband components of the amplitude and phase modulated signal [3]](https://static-01.extrica.com/articles/23888/23888-img13.jpg)
Fig. 11Modulation and sidebands
Vibrations are produced by the mechanical parts of rotating and reciprocating machines for various causes. These include mechanical looseness, misalignment, unbalance, incorrect fittings, and defective components. These vibrations degrade structural reliability, raise maintenance costs, decrease machine efficiency, and frequently result in major health problems for the engine. Faulty vibrations can also indicate equipment or machine parts defects and provide rich information regarding the machine’s condition [58].
In 2022, Sann and Tomeh studied the detection and localization of the vibration and noise sources in the car gearbox using frequency analysis [30]. First, the experiment was conducted to determine the rotational speed of the input shaft at each speed degree using a Microlog CMVA 65 vibration analyzer connected to the gearbox housing with an accelerometer. Then, the frequencies of shafts, gear meshes, and bearings were calculated. Finally, SKF @ptitude Analyst software [59] was used to analyze the amplitudes and spectra of vibration with the frequency analysis and the envelope analysis method. For example, frequency spectrum analysis indicates a fault of input shaft misalignment (case Fig. 16(f)) since the amplitude of the second harmonic component exceeds the amplitude of the first harmonic component by 91.43 %, as shown in Fig. 12.
The 4th and 5th speed degree of differential gear show the increased imbalance value and there is clearance between the driving and driven gear teeth as shown in Fig. 13 and Fig. 14.
Fig. 12Spectrum of vibration of input shaft at the 1st speed degree of 5-speed car gearbox [30]
![Spectrum of vibration of input shaft at the 1st speed degree of 5-speed car gearbox [30]](https://static-01.extrica.com/articles/23888/23888-img16.jpg)
Fig. 13Spectrum of vibration of differential gear at the 4th speed degree of 5-speed car gearbox [30]
![Spectrum of vibration of differential gear at the 4th speed degree of 5-speed car gearbox [30]](https://static-01.extrica.com/articles/23888/23888-img17.jpg)
Fig. 14Spectrum of vibration of differential gear at the 5th speed degree of 5-speed car gearbox [30]
![Spectrum of vibration of differential gear at the 5th speed degree of 5-speed car gearbox [30]](https://static-01.extrica.com/articles/23888/23888-img18.jpg)
In 2014, Tomeh identified the vibration and noise sources on the car gearbox by spectral analysis [20]. First, the measurement of the gearbox with a pinion was made on the SAIMP machine before replacing the rolling bearings FAG 71909 HC CTP4S.UL at Bearing 3. Second, the measurement of the gearbox with a pinion was made on the SAIMP machine after replacing the rolling bearings FAG 71909 HC CTP4S.UL at Bearing 3. The gearbox was loaded on the acceleration and engine braking in each measurement.
Before bearing replacement, the frequency of the inner ring of the bearing is 1618 Hz, the amplitude at this frequency is 2.306 m.s-2, and the effective value of acceleration is 105.7 m.s-2. In Fig. 15(a), the amplitude of the 2nd harmonic is higher than the amplitude of the 1st harmonic, indicating the gear misalignment.
After bearing replacement, the vibration measurements were repeated with the same conditions. The amplitude is reduced from 2.306 m.s-2 to 2.02 m.s-2. The effective value of the acceleration decreased from 105.7 m.s-2 to 8.1 m.s-2. In Fig. 15(b), the amplitude of the 2nd harmonic is lower than the amplitude of the 1st harmonic, indicating no faults.
Fig. 15Vibration acceleration spectrum by order analysis, engine braking, 5th speed gear, before and after replacing rolling bearings FAG 71909 HC CTP4S.UL at Bearing 3 on the SAIMP machine [20]
![Vibration acceleration spectrum by order analysis, engine braking, 5th speed gear, before and after replacing rolling bearings FAG 71909 HC CTP4S.UL at Bearing 3 on the SAIMP machine [20]](https://static-01.extrica.com/articles/23888/23888-img19.jpg)
a)
![Vibration acceleration spectrum by order analysis, engine braking, 5th speed gear, before and after replacing rolling bearings FAG 71909 HC CTP4S.UL at Bearing 3 on the SAIMP machine [20]](https://static-01.extrica.com/articles/23888/23888-img20.jpg)
b)
2.4.5.1. Condition monitoring of gears
Fig. 16 shows the condition monitoring of gear with typical faults such as eccentric gear or bent shaft, tooth damage (wear), backlash, gear misalignment, and hunting tooth frequency.
In Fig. 16(a), the characteristic spectrum of a gear assembly in good condition is shown. It is observed that the first, second, and third harmonics of gear mesh frequencies gradually decrease, indicating no faults are detected.
In Fig. 16(b), the rate at which a tooth in one gear connects with a specific tooth in another gear is known as the hunting tooth frequency (HTF). Symptoms: Peak at 1x HTF and possibly at 2x HTF. HTF sidebands around 1x RPM of each shaft. HTF sidebands around 1x GMF and its harmonics. Low frequency gear pulsating noise [60].
In Fig. 16(c), modulation in the GMF occurs at the eccentric gear's rotating speed due to bent shafts or eccentricity in the gear. Symptoms: Increased amplitude in 1x, 2x and/or 3x GMF. Significant sidebands around 1x, 2x and/or 3x GMF at the 1x RPM frequency of the gear causing the problem. Increased amplitude at 1x RPM of the gear that has the problem, and in case of a serious problem, harmonics will also appear [60].
In Fig. 16(d), significant peaks at the GMF and its harmonics are caused by gear wear. Symptoms: Increased amplitude at 1x, 2x and/or 3x GMF. Important sidebands around 1x, 2x and/or 3x GMF at the frequency 1x RPM of the worn gear. Peaks corresponding to the resonance frequency of the pinion or the gear. Side bands at 1x RPM of the worn gear around the resonance frequency [60].
In Fig. 16(e), the GMF and its harmonics are typically more impacted by an overloaded gear assembly than the relatively few and lower amplitude running speed sidebands. Symptoms: Higher amplitudes in 1x, 2x and/or 3x GMF [60].
In Fig. 16(f), the main vibration of the misaligned shafts happens at 1x RPM and 2x RPM. It can even excite the gear mesh frequency, causing the first three harmonics of the GMF to potentially arise. Symptoms: Amplitude increase in 2x GMF. Peaks in other harmonics of the GMF (1x, 3x, etc.). Important sidebands in 2x GMF and in 1x or even 2x RPM. Harmonics of the rotating speed of each shaft in 2x and even 3x RPM [60].
Fig. 16Typical gear defects and their identification in the frequency spectrum [61], [60]
![Typical gear defects and their identification in the frequency spectrum [61], [60]](https://static-01.extrica.com/articles/23888/23888-img21.jpg)
a) Gear assembly in good condition
![Typical gear defects and their identification in the frequency spectrum [61], [60]](https://static-01.extrica.com/articles/23888/23888-img22.jpg)
b) Hunting tooth frequency
![Typical gear defects and their identification in the frequency spectrum [61], [60]](https://static-01.extrica.com/articles/23888/23888-img23.jpg)
c) Eccentric gear or bent shaft
![Typical gear defects and their identification in the frequency spectrum [61], [60]](https://static-01.extrica.com/articles/23888/23888-img24.jpg)
d) Tooth damage (wear)
![Typical gear defects and their identification in the frequency spectrum [61], [60]](https://static-01.extrica.com/articles/23888/23888-img25.jpg)
e) Overloaded gear assembly
![Typical gear defects and their identification in the frequency spectrum [61], [60]](https://static-01.extrica.com/articles/23888/23888-img26.jpg)
f) Gear misalignment
2.4.5.2. Condition monitoring of bearings
One of the mechanical parts used in rotating machinery is the rolling bearing. Rolling element bearings are frequently subject to localized damage, such as pitting and cracking, because of harsh operating conditions. Rolling bearing failure is one of the main causes of a machine stoppage. Vibration-based rolling bearing defect diagnostics has grown in importance in both academic and industrial domains for several decades due to its potential to prevent accidents and reduce financial losses [62]. Bearing failures can be effectively avoided using condition monitoring [63]. Typical bearing defects like outer race, inner race, roller elements, and cage defect and their identification in the frequency spectrum are shown in Fig. 17.
Fig. 17Typical bearing defects and their identification in the frequency spectrum [64]
![Typical bearing defects and their identification in the frequency spectrum [64]](https://static-01.extrica.com/articles/23888/23888-img27.jpg)
a) Outer race defect
![Typical bearing defects and their identification in the frequency spectrum [64]](https://static-01.extrica.com/articles/23888/23888-img28.jpg)
b) Inner race defect
![Typical bearing defects and their identification in the frequency spectrum [64]](https://static-01.extrica.com/articles/23888/23888-img29.jpg)
c) Roller element defect
![Typical bearing defects and their identification in the frequency spectrum [64]](https://static-01.extrica.com/articles/23888/23888-img30.jpg)
d) Bearing cage defect
In Fig. 17(a), the existence of outer race fault frequency harmonic peaks characterizes the spectrum between 8 and 10 harmonics of the BPFO.
In Fig. 17(b), multiple harmonic peaks of the inner race fault frequency modulated by sidebands at 1x RPM are visible in the spectrum usually between 8 and 10 BPFI harmonics.
In Fig. 17(c), defects in balls or rollers are identified by their existence in the rolling element fault frequency (BSF) harmonic spectrum. The harmonic of larger amplitude typically indicates the number of defective balls or rollers usually accompanied by defects on the races.
In Fig. 17(d), cage defects are identified by the existence of the cage fault frequency (FTF) and its harmonics in the spectrum. A defect in the cage is accompanied by faults in the races and the FTF usually modulates one of these race fault frequencies resulting in sums and/or differences of frequencies.
2.4.6. Units
The numerical range of big or small numbers is reduced when decibels are used. The following Eq. (8) is used to convert the RMS of a physical quantity, represented by , to dimensionless decibel [3]:
where is a reference value given in Table 1.
Table 1Reference values to determine decibels
Sound pressure | Displacement | Velocity | Acceleration | Force | Voltage | |
2×10⁻⁵ Pa | 10-12 m | 10-9 m/s | 10-6 m/s2 | 10-6 N | 1 V |
2.5. Order analysis
Time records measured in dimensionless revolutions instead of seconds are used to analyze the order spectra. The accompanying FFT spectra are measured in dimensionless orders instead of frequency in hertz. Since the rotation frequency is being tracked and analyzed, this method is known as order or tracking analysis [3]. Order analysis is the number of events per rotation.
To convert from order analysis to frequency domain, the Eq. (9) is used:
To convert from frequency to order domain, the Eq. (10) is used:
where is frequency in [Hz], is in order, and is speed of input shaft in [rpm].
Fixed frequency in the signal will be distributed in order analysis when input speed changes. The amplitude of gear mesh orders may vary while input speed changes. These formulas are correct for the typical case where the input shaft speed is used as the reference speed. In other cases, simply replace the input shaft speed with the chosen reference speed.
2.5.1. Shaft and gear mesh order calculation
The noise produced by transmission units is high frequency. The order spectrum of a gearbox vibration contains gear mesh frequency, calculated as the product of the number of teeth and the gear's rotation frequency. Gearboxes have many shafts rotating at various rotational speeds. For the assignment of the spectrum component to the vibration and noise sources, it is essential to know the factor value, which multiplies the fundamental frequency, to get the frequency of the spectrum component. This factor value ascertains the possible source of vibration. Fig. 18 shows an example of the car gearbox where denotes drive gear, denotes driven gear, and denotes gear mesh. Input speed is used as a reference for order calculation. Then, the order of shaft1 is considered as 1. Shaft and gear mesh orders are determined using Eq. (11) to (15):
where denotes the order and denotes the number of gear teeth.
Fig. 18Schematic of a car gearbox
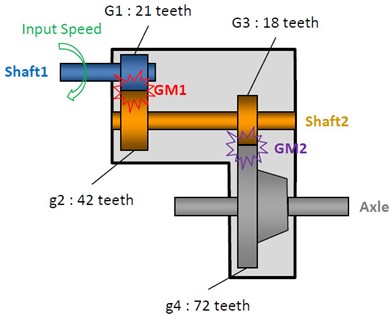
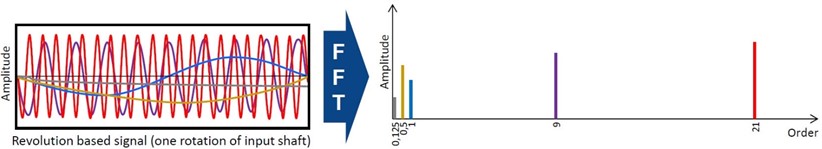
Fig. 19 shows the conversion of the revolution-based signal to the order spectrum of a car gearbox using FFT. The blue, red, blond, purple, and gay curves represent the excitation signal of shaft1, GM1, shaft2, GM2, and axle, respectively. The blue, red, blond, purple, and gay bars represent the order spectra of the excitation signals of shaft1, GM1, shaft2, GM2, and axle, respectively, after FFT. Therefore, the fundamental order of shaft1 is 1 with the 2nd harmonic order of 2 and the 3rd harmonic order of 3, etc. The fundamental order of GM1 is 21, with the 2nd harmonic order of 42 and the 3rd harmonic order of 63, etc. The fundamental order of shaft2 is 0.5, with the 2nd harmonic order of 1 and the 3rd harmonic order of 1.5, etc. The fundamental order of GM2 is 9, with the 2nd harmonic order of 18 and the 3rd harmonic order of 27, etc. The fundamental order of the axle is 0.125, with the 2nd harmonic order of 0.25 and the 3rd harmonic order of 0.375, etc.
Fig. 19Conversion of the revolution-based signal to the order spectrum of a car gearbox using FFT
2.5.1.1. Example of order calculation
Fig. 20 shows an example of a 7-speed dual-clutch transmission (DCT) for a more detailed explanation of the formula and better clarity about the order calculation of shafts and gear meshes.
Table 2 and Table 3 shows shaft and gear mesh order calculations of 1st, 2nd, 3rd, 4th, 5th, 6th, 7th, and reverse gear.
Fig. 20Example of a 7-speed dual clutch transmission (DCT)
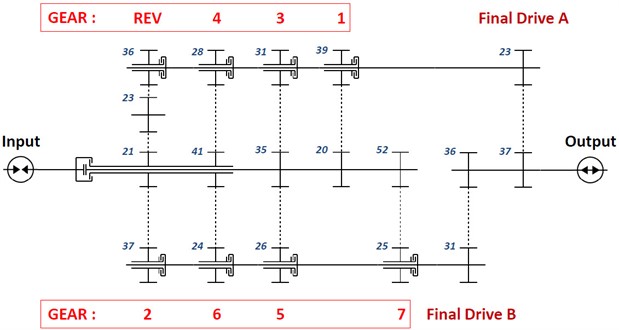
Table 2Shaft and gear mesh order calculations of 1st, 2nd, 3rd, 4th, 5th, 6th, and 7th gear
1st gear | 2nd gear | 3rd gear | 4th gear | 5th gear | 6th gear | 7th gear | |
Input shaft order | 1 | 1 | 1 | 1 | 1 | 1 | 1 |
Gear mesh order | 1×20 = 20 | 1×21 = 21 | 1×35 = 35 | 1×41 = 41 | 1×35 = 35 | 1×41 = 41 | 1×52 = 52 |
Countershaft order | 1×20/39 = 0.5128 | 1×21/37 = 0.5676 | 1×35/31 = 1.1290 | 1×41/28 = 1.4643 | 1×35/26 = 1.3462 | 1×41/24 = 1.7083 | 1×52/25 = 2.0800 |
Final drive gear mesh order | 1×20/39×23 = 11.7949 | 1×21/37×31 = 17.5946 | 1×35/31×23 = 25.9677 | 1×41/28×23 = 33.6786 | 1×35/26×31 = 41.7308 | 1×41/24×31 = 52.9583 | 1×52/25×31 = 64.4800 |
Output shaft order | 1×20/39×23/37 = 0.3188 | 1×21/37×31/36 = 0.4887 | 1×35/31×23/37 = 0.7018 | 1×41/28×23/37 = 0.9102 | 1×35/26×31/36 = 1.1591 | 1×41/24×31/36 = 1.4711 | 1×52/25×31/36 = 1.7911 |
Table 3Shaft and gear mesh order calculations of reverse gear
Reverse gear | |
Input shaft order | 1 |
Reverse gear mesh order | 1×21 = 21 |
Idler shaft order | 1×21/23 = 0.9130 |
Idler gear mesh order | 1×21/23×23 = 21 |
Countershaft order | 1×21/23×23/36 = 0.5833 |
Final drive gear mesh order | 1×21/23×23/36×23 = 13.4167 |
Output shaft order | 1×21/23×23/36×23/37 = 0.3626 |
2.5.2. Bearing order calculation
Under constant speed conditions, the bearing faults are detected by directly identifying the Fault Characteristic Frequency (FCF). However, the FCFs are not constant under variable rotating speed conditions. The Fault Characteristic Order (FCO) is applied to monitor the health status of the bearing at time-varying rotating speed [65].
To calculate the order of bearing cage, rolling element pass in inner ring, rolling element pass in outer ring, and rolling element, the equations from Eqs. (16) to (19) are used [66], [65], [55].
Order of bearing cage:
Order of rolling element pass in inner ring:
Order of rolling element pass in outer ring:
Order of rolling element:
where is order of inner ring, is order of outer ring, is pressure angle, is radius rolling element, is radius inner ring, and is number of rolling elements.
2.5.3. Utilizing order spectra in machine diagnostic applications
Order spectra are a helpful tool for machine troubleshooting. Fig. 21 displays the order spectrum composition for specific vibration source types. The selected basic frequency determines the order spectrum. Numerous machines possess multiple frequencies that are considered fundamental. Gearboxes, for instance, have many shafts that rotate at various speeds. Knowing the value of the factor that multiplies the fundamental frequency to obtain the frequency of the spectrum component is crucial for assigning the spectrum component to the source of vibration or noise. The possible vibration source is likewise determined by the value of this factor. In Fig. 21, all the other dominant components – except for rolling bearings – are harmonics of the fundamental frequency. The frequency of vibration resulting from rolling bearing faults is a non-integer multiple of the inner race’s rotational frequency.
Fig. 21Order spectra in machine diagnostics [3]
![Order spectra in machine diagnostics [3]](https://static-01.extrica.com/articles/23888/23888-img34.jpg)
2.6. Statistical analysis
Data on noise and vibration are analyzed using statistical techniques, such as mean, standard deviation, and percentile levels. It offers data on the statistical distribution of vibration and noise data. It only offers a little in the way of temporal and frequency characteristics of vibration and noise. It might not be appropriate for nonlinear data and presumes that the data is regularly distributed. Eqs. (20) and (21) are used to calculate mean and standard deviation [15].
Mean:
Standard deviation:
where is mean, is standard deviation, is data size, and is data values, 1, 2,…
2.7. Signal processing
Digital signal processing techniques, like filtering and waveform analysis, are used in signal processing to analyze vibration and noise data. It offers details on the temporal and frequency characteristics of vibration and noise. However, it requires specialized equipment and expertise. It requires knowledge of signal processing techniques and may introduce artifacts or distortions [15]. Eq. (22) represents the output signal that is obtained by convolving the input signal with the impulse response :
2.8. Fourier analysis
A complicated waveform is broken down into a series of sine waves with varying frequencies and amplitudes using Fourier analysis. It offers comprehensive details on a signal's frequency composition, which is helpful for vibration and noise analysis. It does, however, need stable and continuous data. Windowing and spectral leakage could have an impact on it. Time domain information can be lost. The assumption is that the signal is stationary and periodic. For reliable results, a lot of data may be needed. The Fourier series and Fourier transform are calculated using Eqs. (23) and (24), respectively [15].
Fourier series:
Fourier transform:
where is time domain signal, and is mother or basis equation.
2.9. Time-domain analysis
The time waveform itself serves as the primary foundation for time-domain analysis. Traditional time-domain analysis determines characteristic features by calculating descriptive statistics like mean, peak, peak-to-peak interval, standard deviation, crest factor, and high-order statistics (root mean square, skewness, kurtosis, etc.) from time waveform signals. Typically, these attributes are referred to as time-domain features. Time Synchronous Average (TSA) analysis is a common time-domain analysis method. TSA aims to enhance the signal components of interest by reducing or eliminating noise and influences from other sources by using the ensemble average of the raw signal over several evolutions. Root Mean Square (RMS) is a kind of average of signal; for discrete signals, the RMS value is defined using Eqs. (25) and (26) [4]:
where is average, is number of samples, and is sample.
2.10. Frequency-domain analysis
To determine the extent of element damage, they use the difference in power spectral density of the signal caused by a gear and/or bearing failure. Any signal in the actual world can be decomposed into a set of distinct sine waves. In the frequency domain, each sine wave isolated from the signal is represented by a vertical line. Its position indicates frequency, while its height indicates amplitude. The signal is the frequency domain representation of the signal. The frequency domain entirely defines the vibration. When it comes to rotating machinery, frequency domain analysis finds defects and pinpoints their root cause [13].
Fig. 22Measurements of time domain vs. frequency domain [68]
![Measurements of time domain vs. frequency domain [68]](https://static-01.extrica.com/articles/23888/23888-img35.jpg)
Each sine wave is presented as a spectral component in the frequency domain, as shown in Fig. 22. Frequency analysis is often referred to as spectrum analysis, which is one of the most widely used vibration analysis methods for machine condition monitoring. Frequency domain analysis techniques can provide information based on characteristics of frequencies that are difficult to perceive in the time domain. The measured time domain vibration signals are usually generated by several elements of a rotating machine, for instance, gear, bearing, and shaft, where a single motion of an element produces a sine wave with a single frequency and amplitude, and other elements include further frequencies. Each rotating machine component generates a single frequency. However, these produced frequencies individually in the measured signal cannot be seen; a summation of the sensor’s measured signals can be seen. The time domain waveforms produce a spectrum of frequency components that facilitate the visualization of individual vibration sources [67].
2.10.1. Conversion to the frequency domain
The frequency domain representation of a signal can be described by the Fourier Transform of its time domain representation:
where is the original function in time domain, is the Fourier transform of the function .
The Inverse Fourier Transform can be used to convert from a frequency domain representation to the time domain [13]:
where is the square root of –1 and denotes the natural exponent, stands for time, stands for frequency, and denotes the signal in frequency domain.
2.10.2. Fast Fourier transform (FFT) analyzers
Most modern spectrum analyzers use the FFT, which is an efficient algorithm for performing a Discrete Fourier Transform (DFT) of discrete sampled data [13].
Discrete Fourier transform:
where is a projection/image of DFT, denoted as , .
Inverse Discrete Fourier Transform denoted for samples :
2.11. Time-frequency analysis
Non-stationary signals are examined using time-frequency analysis in the time-frequency domain. It offers details on a signal's frequency and time characteristics. It makes it possible to detect short-term variations in the amplitude and frequency of the signal. It is helpful in the analysis of transient events. Its computational requirements are significant, nevertheless. Without the necessary information, interpreting the results is challenging. The accuracy of the results depends on the windowing function and its parameters. It may experience scalloping and spectral leakage. It is a limited time–frequency resolution trade-off. Eq. (31) and (32) are used to calculate the short-time Fourier transform and wavelet transform [15].
For any signal , suppose is a window function centered at time where is a time variable. Then, the observed or segmented signal through this window is . Sliding the window through the time span of interest and applying the Fourier transform to each segment leads to the short-time Fourier Transform [69]:
The wavelet transform employs wavelets, instead of sinusoidal functions, as the basis. It adds a scale variable and time variable in the inner product transform. Hence, it is effective for time-frequency localization and is suited to transient signal analysis. For any energy limited signal , the wavelet transform can be defined as [69]:
where wavelet is derived by dilating and translating the wavelet basis , is the scale parameter , is the time shift, and is a normalization factor to maintain energy conservation.
2.12. Spectral analysis
By breaking down a signal into its frequency components, spectral analysis measures its power in the frequency domain. It offers frequency-specific information that can be used to identify trends and periodicities in a signal. However, it cannot catch signals that fluctuate over time and has a limited time resolution. It is subject to noise and artifacts and presumes stationarity and linearity. Eq. (33) is used to calculate the periodogram [15].
Periodogram:
where is the power spectral density at frequency , is the Fourier transform of the signal , is the sampling frequency of the signal.
2.13. Wavelet analysis
A mathematical method for analyzing signals with fluctuating frequencies across time is called wavelet analysis. It is capable of concurrently analyzing signals of high and low frequencies. High time-frequency resolution is offered by it. For non-stationary signals, it is helpful. However, it involves complex mathematics. The results can be hard to understand. It is restricted to signals having established frequency properties. It can be computationally intensive. Eqs. (34), (35), and (36) are used to determine continuous wavelet transform and discrete wavelet transform [15].
Continuous wavelet transform:
Discrete wavelet transform:
2.14. Signal analysis
The signal analysis examines and processes signals to extract helpful information or understand their characteristics. A signal can be understood as any pattern of temporal or spatial variation that carries some form of information. In signal analysis, one often works in both the time and frequency domain. Time domain analysis focuses on changes in the signal over time, while frequency analysis examines the composition of the signal in terms of its frequencies. For these purposes, the Fourier transform is often used, which enables the signal to be converted from the time domain to the frequency domain. An essential part of signal analysis is signal processing, which includes various techniques to improve signal quality or interpretability. This may include filtering, amplification, compression, or noise reduction.
2.14.1. Bispectrum
The bispectrum can be seen as a decomposition of the third moment of a signal over frequency and can identify non-symmetric non-linearities. For a stationary random process, the discrete bispectrum can be determined in terms of the signal’s Discrete Fourier Transform as [70]:
It was defined a relative parameter contained the sum of all values of the bispectrum defined by:
where denotes the bispectrum parameter of the system with damage and denotes the bispectrum parameter of the system without damage.
2.14.2. Wavelet theory
The continuous wavelet transform (CWT) is determined by using Eqs. (40) and (41) [70]:
is a window function called the mother wavelet, where is a scale and is a translation.
2.14.3. Mathematical morphology
Mathematical morphology has been applied with other techniques, including bispectrum and wavelet analysis, to identify defects in automotive gearboxes. Researchers have demonstrated that these methods are effective in detecting the existence of damage within gearboxes. These methods have been used to improve the quality control of automotive gearboxes by analyzing vibration signals, which can reveal the presence of defects that may lead to failure or malfunction [70], [71].
If is the original 1-D signal, which is the discrete function over a domain and is the SE (flat structuring element), which is the discrete function over a domain , two basic morphological operators, the erosion and the dilation, can be determined as [70]:
where denotes the erosion operator and denotes the dilation operator.
Based on the dilation and erosion, two other basic morphological operators, the opening, and the closing, can be calculated:
where denotes the opening operator and denotes the closing operator.
The morphological features of a signal can be extracted using these four morphological operators; however, different operators fit different morphological features [72], [27]. A mathematical morphology analysis incorporating SEs at different scales is called multi-scale mathematical morphology. The multi-scale morphological analysis of 1-D signals relies significantly on the SE scale, particularly the length scale. Opening and closing operations are also included in the multi-scale morphological operations. A flat SE has a flat shape, zero height, and a specified length. Its elements are all zeros. The number of zero elements distinguishes different SEs, with {0 0 0} being the simplest flat SE. Generally, the longer the element of a flat SE, the better its low-pass capability. Two non-zero elements are present at the double-dot SE's two ends; the remaining are 0s. Two non-zero elements of the double-dot SE play a significant part in the morphological operation differently from other elements, and their locations change from scale to scale [73]. For example, scale 1, 2, and 3 have double-dot SE of {1 0 1}, {1 0 0 1}, and {1 0 0 0 1}, respectively.
Two pattern spectra’s correlation coefficient is represented as [27]:
where and denote two different pattern spectra, and denotes their correlation coefficient measuring the similarity of two signals.
2.15. Modal analysis
Modal analysis is a crucial component in designing many structures, particularly in the initial phases of development. Gearboxes have various excitation effects, including bearing frequencies, gear mesh frequencies, and input and output shaft speeds. A gearbox may sustain damage if the excitation and natural frequencies are the same. The results of modal analysis are natural frequencies, modal shapes that correspond to natural frequencies, and modal damping. These parameters give an overview of the fundamental dynamics of construction behavior. Modal analysis is a linear dynamic-response procedure that assesses and superimposes free-vibration mode shapes to characterize displacement patterns. Mode shapes describe the configurations into which a structure will naturally displace. Patterns of lateral displacement are usually the main issue. Low-order mathematical expression mode shapes typically contribute more to the structural response. Mode shapes contribute less and are less reliably predicted as orders increase. When there are enough mode shapes, it makes sense to truncate the analysis [74].
The process of developing a mathematical model to represent a system's dynamic behavior involves identifying its natural frequencies, damping factors, and mode shapes. This is known as modal analysis. Free vibrations of an MDOF system can be studied, starting from its undamped equation of motion [75]:
where denotes the mass matrix, generally positive definite, is the stiffness matrix which is semi-positive definite in case the system shows rigid body modes. The non-trivial solution of Eqs. (39) offers the free vibration of the system. Imposing a motion type where the same time function determines all Lagrangian coordinates, i.e. , leads to [75]:
Non-trivial solutions are those for which the matrix is singular:
denotes an Eigenvalue problem, where denotes the Eigenvalue and denotes the Eigenvector.
The mountings that support electric axles isolate the disturbance originating from the system from the vehicle structure. To calculate the six low-frequency rigid modes, the mass matrix assumes the following form [75]:
where denotes the total mass of the system and denotes the components of the mass moment of inertia tensor around each axis. Static and dynamic stiffness characteristics of the mountings determine the stiffness matrix.
Modal analysis can also be used to analyze the dynamic characteristics of the gearbox and identify weak areas in the design for structure optimization [76]. Modal analysis has been applied to heavy vehicle truck transmission gearbox housing made from different materials and to differential gearboxes [77].
2.16. Cepstrum analysis
Typically, vibration signals are a result of both source and transmission path effects. For instance, internal forces within a machine can cause vibrations in a structure whose properties can be characterized by a frequency response function between the application and measurement points. The time signals involve influences from both the source and the transmission path. In the spectra, these are multiplicative; in the logarithmic spectral and cepstral domains, they are additive. The forward Fourier transformation of a spectrum's logarithm is called a cepstrum. As a result, it is the spectrum of a spectrum and possesses properties that are helpful in various kinds of signal analysis. Its ability to detect periodicities, or repetitive patterns, in a spectrum and identify one or two specific cepstrum components is one of its more powerful attributes. The overlap between multiple sets of sidebands or harmonic series in a spectrum can be confusing. Cepstrum will, nevertheless, be divided similarly to how the spectrum separates repeating time patterns in a waveform. For cepstrum analysis, gearboxes and rolling element bearing vibrations are particularly suitable candidates [78].
Cepstrum, an anagram of the spectrum, is a nonlinear signal processing method used to locate and distinguish harmonic families in the spectra of gearbox signals. Cepstrum is also used in speech signal processing and echo cancellation. Table 4 compares the terms used in the spectral and cepstral analyses. The inverse Fourier transform of a type of spectrum's natural logarithm is required to calculate the cepstrum. Specific definitions differ in the literature. Given an actual signal, different cepstrum forms can be determined [78]:
If the phase information of the original time waveform is retained, the cepstrum is complex since both the Fourier transform and the inverse Fourier transform are complex-domain processes. The complex cepstrum has the corresponding inverse complex cepstrum. In this instance, a modified cepstrum can recreate the time waveform. As a result, signal separation and noise reduction applications like echo cancellation can benefit from the complex cepstrum. Conversely, the cepstrum is a real value if the input of the inverse Fourier transform is real, such as a power spectrum or the signal’s Fourier transform magnitude. Despite the inability to reconstruct the real value cepstrum into the time domain, it is possible to “lifter” a harmonic family in the quefrency domain, resulting in a liftered spectrum.
Table 4Comparisons of terms used in spectral and cepstrum analysis
Frequency analysis | Cepstral analysis |
Spectrum | Ceptrum |
Frequency | Quefrency |
Harmonics | Rahmonics |
Filter | Lifter |
Phase | Saphe |
Magnitude | Gamnitude |
Low pass filter | Short pass lifter |
High pass filter | Long pass lifter |
2.17. Transmission error (TE)
Since TE is a source of excitation, it is thought to be one of the major factors influencing a transmission's noise levels [79].
The difference between the theoretical and actual relative angular positions between a pinion and a gear is called TE. In Fig. 23, TE means a deviation in the angular rotation, , of the gear and the theoretical rotation calculated by multiplying the angular rotation, , of the pinion and the gear ratio . It can be computed as [3], [8], [80]:
where is the number of teeth of gear and is the number of teeth of pinion.
If the gear had a perfect involute profile with no deformation, allowing to maintain a constant tooth interval. Then, TE would not occur. However, tooth meshing errors are caused by several reasons in practice. For instance, TE can be brought by geometric errors, elastic deformation of the gears and related components, and errors resulting from faulty mounting during unit assembly.
Fig. 23Definition of transmission error [8]
![Definition of transmission error [8]](https://static-01.extrica.com/articles/23888/23888-img36.jpg)
The geometric deviation of the gear, profile, spacing, and runout errors from the manufacturing process causes Geometric TE (GTE). Gear deformation is measured in the unloaded condition and during low-speed rotation. Elastic deformation of the gears, errors relating to gear deformation, and local contact deformation from each meshing tooth pair cause static TE (STE). It includes errors due to geometric deviation and is measured at low speed with loads. In addition to the errors of GTE and STE, the effects of inertia are included in dynamic TE (DTE).
Assuming that inertial effects in steady-state rotation are negligible, STE, including GTE errors, is analyzed. TE is determined using the following Eq. (55) by converting each angular rotation of the gear and pinion in Eq. (54) into a linear displacement using the pitch circle radius :
where .
3. Diagnostic methods of rolling element bearings
In rotating mechanical systems, rolling-element bearings are frequently utilized, and their operating state significantly impacts the entire mechanical system's accuracy, reliability, and life. Therefore, rolling bearing fault detection is essential to the health monitoring of rotating machinery systems. Consequently, the costs associated with manufacturing and emergency maintenance are reduced. Impulses are produced in a mechanical system when a rolling element strikes a localized fault. The impulses are generated periodically, and their characteristics depend on the location of the defect, such as outer race, inner race, cage, and rolling elements [81], [82].
Table 5 shows the summary of diagnostic methods of rolling element bearings such as the Shock Pulse Method, Bearing Condition Unit Method, Kurtosis Method, Spike Energy Method, K(t) Parameter Method, Crest Factor Method, Q-Method, Envelope Analysis Method, and Spectral Emitted Energy Method.
Table 5Rolling element bearing diagnostic methods of car gearboxes
Methods | Description | Advantages | Disadvantages |
References | |||
Shock pulse method (SPM) [83], [63] | SPM produces a maximum normalized shock value (dB) that may distinguish between a heavy fault, a weak fault, and a healthy state. This value indicates the condition of the bearing. where is rotating speed of the bearing, and denotes the inner diameter. Shock value (SV) is calculated by demodulating bearing vibration data. The dB value can be used to approximate the bearing's running condition. : healthy bearing : weak fault : heavy fault | Accurate and quick. Quality of lubrication may be found out. It is demanding for the probe orientation and adherence to the measurement conditions | Specific parameters of the bearings need to be known. Stable measurement screws for the trend analysis must be mounted |
Bearing condition unit (BCU) method [84] | A shock pulse from the defective bearing excites vibrations in the sensor installed on the bearing and within its resonant area of 20-40 kHz. Depending on the contents of the excitation spread throughout the solid material, there is a shorter or longer response to the vibration. The inner energy of the fading away vibration is quantified and evaluated, along with the frequency. After that, BCU is established | While measuring the absolute vibration using VIBROPORT 30, BCU is also determined | It has not yet been generally accepted and depends on the bearing dimensions |
Kurtosis method [85], [86] | Kurtosis, a statistical parameter, measures the tailedness of the probability distribution of a real-valued random variable. It is used for bearing condition evaluation. where denotes the instantaneous amplitude, denotes the mean, denotes the standard deviation of the data and denotes the sample length | This light and portable device provides information about the monitored bearing | Measurement of gear mechanisms under 1000 rpm is time-consuming. An untrue estimation is in the case of double-row roller bearings and spherical roller bearings. It is impossible to measure so-called big bearings where the size of the bearing is not defined in the instructions for measurement |
Spike energy (SE) method [84] | Applied with disassembly-free diagnostics of rolling element bearings, it follows from three measures, such as the mean value of the acceleration within the frequency band 5-50 kHz, the pulse frequency, and the amplitude of the pulse acceleration | It is a cheap and quick method. Along with measuring the absolute vibration, SE can be obtained as well | A touch probe is used; the estimated damage to the bearing follows from a subjective opinion by the diagnostician |
parameter method [86] | The parameter computation approach yields findings that are comparatively better. It is ideal for evaluating the bearing status and operates on a similar concept to the crest factor. where (or ) is a peak-to-peak acceleration in the time of the bearing mounting (or in the time from the beginning of the bearing working) and (or ) is a RMS acceleration in the time of the bearing mounting (or in the time from the beginning of the bearing working). The bearing state is evaluated according to value of the K(t) parameter: : wrecking state : damaged bearing : good bearing | It is reliable, and its validity limits are not known. The method is easy, quick, and independent of the direction of the measurement. Thus, the instrument may be widely used | Parameter is used only on one instrument by one company, Robotron |
Crest factor method [87] | It quantifies how impulsive a vibration or noise signal is. It is frequently applied to shocks, impulsive noises, and short events. A sine wave's CF is 1.414, whereas genuinely random noise typically has a CF of less than 3. CF can have a value of 2 to 6 during regular operations. A number greater than six is typically indicative of equipment issues | It is a simple method with low costs. It is a quick method for identifying the failure path. It is the same as the digitized signal's peak to RMS value ratio | Sensitive to influence from other sources of acceleration, which means it gives just a rough idea of the condition of the bearing |
Q-method [84] | It is a new method for assessing the technical state of rolling-element bearings. It was created by the Faculty of Electrical Engineering at the Czech Technical University in Prague. The Diagnose D016 FEL device is utilized with the new technique. The ultrasonic signal that the bearing emits is measured by the device using the ratio of its peak amplitude to its mean amplitude. A frequency range of 10 kHz to 40 kHz is used for the test | The diagnostics of the bearing do not depend on operating velocity, bearing dimensions, or load. Thus, the results are a quick and accurate diagnosis in 15 seconds | It is a single-purpose device that existed in several prototypes in 1989 |
Envelope analysis method [88], [89] | To ascertain the type of bearing failure or the condition of a gear, the envelope or high-frequency technique concentrates on the structural resonance. The spectrum of the raw signal often contains little diagnostic information about bearing faults, and over many years it has been established that the benchmark method for bearing diagnostics is envelope analysis, where a signal is bandpass filtered in a high frequency band in which the fault impulses are amplified by structural resonances. It is the amplitude demodulated to form the envelope signal, whose spectrum contains the desired diagnostic information in terms of both repetition frequency as well as modulation by the appropriate frequency at which the fault is passing through the load zone | If a rolling element bearing has a defect in its outer race, then each rolling element passing through this location will generate a small repeating signal with a frequency corresponding to the fault in the bearing. It has shown successful results in the early detection of bearing faults and can help distinguish the actual cause of bearing failure by inspecting the actual bearing defect frequencies | Signals from rolling bearing damage have such low energy that they are completely lost in noise and other exciting rotational frequencies during normal measurement (total frequency spectrum) |
Spectral emitted energy (SEE) method [84] | SEE provides early detection of damage to bearings or cogs by measuring the acoustic emission generated by metal if it is damaged or under certain specific conditions | SEE provides early detection of bearing and gear transmission faults | SEE uses special sensors. Damage to bearing elements appears in the frequency range of 150-500 kHz. Such a signal is not so much a vibration signal; it is rather a sound with a high frequency |
4. Conclusions
The excitation of the shafts, gear meshes, and bearings are the primary causes of noise and vibration in automobile gearboxes. A review of methods of detection and localization of the sources of noise and vibration on car gearboxes has been summarized. It was observed that frequency analysis and order analysis were commonly used in noise and vibration analysis on car gearboxes. Furthermore, envelope analysis is usually used to analyze bearing faults. Moreover, recent research on manual transmission gearboxes was examined. Vehicle gearbox noise and vibration causes were identified using frequency analysis, order analysis, statistical analysis, signal processing analysis, Fourier analysis, time-domain analysis, frequency-domain analysis, time-frequency analysis, spectral analysis, wavelet analysis, signal analysis, modal analysis, cepstrum analysis, and transmission error. Finally, rolling element bearing diagnostic techniques such as shock pulse, bearing condition unit, Kurtosis, spike energy, parameter, crest factor, Q-method, envelope analysis, and spectral emitted energy method were reviewed.
References
-
A. H. Afaneh, M. K. Abdelhamid, and M. S. Qatu, “Engineering challenges with vehicle noise and vibration in product development,” in SAE 2007 Noise and Vibration Conference and Exhibition, pp. 2007–1, May 2007, https://doi.org/10.4271/2007-01-2434
-
R. Latfullin, B. Reff, G. Böttcher, T. Böttcher, and L. Eckstein, “System level Nvh analysis using a dedicated chassis test rig,” Aachen Acoustics Colloquium, Vol. 25, 2019.
-
J. Tůma, Vehicle Gearbox Noise and Vibration: Measurement, Signal Analysis, Signal Processing and Noise Reduction Measures. Wiley, 2014, https://doi.org/10.1002/9781118797563
-
Sameh M. Metwalley, Nabil Hammad, and Shawki A. Abouel-Seoud, “Vehicle gearbox fault diagnosis using noise measurements,” Journal of Mechanical Engineering Research, Vol. 2, No. 6, pp. 116–125, Nov. 2010, https://doi.org/10.5897/jmer.9000050
-
N. Inavolu, S. N. Kumar, K. Kamani, and J. R. M., “Driveline noise source identification and reduction in commercial vehicles,” in 10th International Styrian Noise, Vibration and Harshness Congress: The European Automotive Noise Conference, pp. 2018–1, Jun. 2018, https://doi.org/10.4271/2018-01-1474
-
X. Jin, F. Cheng, Y. Peng, W. Qiao, and L. Qu, “Drivetrain gearbox fault diagnosis: vibration – and current-based approaches,” IEEE Industry Applications Magazine, Vol. 24, No. 6, pp. 56–66, Nov. 2018, https://doi.org/10.1109/mias.2017.2740470
-
Jiri Tuma, “Simple gear set dynamic transmission error measurements,” in the 13th International congress on sound and vibration, 2006.
-
D.-H. Lee, K.-H. Moon, and W.-Y. Lee, “Characteristics of transmission error and vibration of broken tooth contact,” Journal of Mechanical Science and Technology, Vol. 30, No. 12, pp. 5547–5553, Dec. 2016, https://doi.org/10.1007/s12206-016-1123-4
-
M. Bozca, “Transmission error model-based optimisation of the geometric design parameters of an automotive transmission gearbox to reduce gear-rattle noise,” Applied Acoustics, Vol. 130, pp. 247–259, Jan. 2018, https://doi.org/10.1016/j.apacoust.2017.10.005
-
M. S. Qatu, “Recent research on vehicle noise and vibration,” International Journal of Vehicle Noise and Vibration, Vol. 8, No. 4, p. 289, Jan. 2012, https://doi.org/10.1504/ijvnv.2012.051536
-
M. S. Qatu, M. K. Abdelhamid, J. Pang, and G. Sheng, “Overview of automotive noise and vibration,” International Journal of Vehicle Noise and Vibration, Vol. 5, No. 1/2, Jan. 2009, https://doi.org/10.1504/ijvnv.2009.029187
-
M. A. Panza, “A review of experimental techniques for NVH analysis on a commercial vehicle,” Energy Procedia, Vol. 82, pp. 1017–1023, Dec. 2015, https://doi.org/10.1016/j.egypro.2015.11.861
-
Nava Stone, “Vibration analysis techniques for gearbox diagnostic: a review,” International Journal of Advanced Engineering Technology, Vol. 3, No. 3, 2012.
-
S. Bharadwaj, A. Gupta, and S. Narayan, “A review of various NVH sources of combustion engines,” International Journal of Mechanical Engineering and Automation, Vol. 3, No. 6, pp. 249–261, 2016.
-
D. Khan and R. Burdzik, “Measurement and analysis of transport noise and vibration: a review of techniques, case studies, and future directions,” Measurement, Vol. 220, p. 113354, Oct. 2023, https://doi.org/10.1016/j.measurement.2023.113354
-
H. Naunheimer, B. Bertsche, J. Ryborz, and W. Novak, Fundamentals, Selection, Design and Application. Berlin, Heidelberg: Springer Berlin Heidelberg, 2011, https://doi.org/10.1007/978-3-642-16214-5
-
T. Petr, J. Brousek, J. Jezek, T. Zvolsky, and R. Vozenilek, “Measuring the efficiency of reduction gearboxes for electric utility vehicles during specific driving cycles,” Strojniški vestnik – Journal of Mechanical Engineering, Vol. 68, No. 5, pp. 303–313, May 2022, https://doi.org/10.5545/sv-jme.2021.7437
-
J. E. Duffy, Modern Automotive Technology. Tinley Park, IL: The Goodheart-Willcox Company, 2017.
-
J. Tuma, “Gearbox noise and vibration prediction and control,” The International Journal of Acoustics and Vibration, Vol. 14, No. 2, Jan. 2009, https://doi.org/10.20855/ijav.2009.14.2242
-
E. Tomeh, “Identify the sources of vibration and noise on cars gearbox by spectral analysis,” in Lecture Notes in Mechanical Engineering, Cham: Springer International Publishing, 2014, pp. 205–211, https://doi.org/10.1007/978-3-319-05203-8_29
-
T. Praveenkumar, M. Saimurugan, P. Krishnakumar, and K. I. Ramachandran, “Fault diagnosis of automobile gearbox based on machine learning techniques,” Procedia Engineering, Vol. 97, pp. 2092–2098, Jan. 2014, https://doi.org/10.1016/j.proeng.2014.12.452
-
K. He, X. Liu, and X. Li, “Experimental study of the vibration characteristics of the fault cylindrical roller bearing of special vehicle gearbox,” International Journal of Vehicle Noise and Vibration, Vol. 12, No. 3, p. 241, Jan. 2016, https://doi.org/10.1504/ijvnv.2016.080139
-
E. Tomeh, “Possibilities for reducing car gearbox vibration and noise,” Advances in Mechanism Design II, Vol. 44, pp. 255–262, Aug. 2016, https://doi.org/10.1007/978-3-319-44087-3_33
-
T. Oudrnický and E. Tomeh, “Noise level of reverse motion gearing of gearbox,” Vibroengineering Procedia, Vol. 11, pp. 173–178, May 2017, https://doi.org/10.21595/vp.2017.18564
-
A. Widodo, D. Satrijo, T. Prahasto, and I. Haryanto, “Fault detection of gearbox using time-frequency method,” 7th International Conference on Mechanical and Manufacturing Engineering, Sustainable Energy Towards Global Synergy, Vol. 1831, No. 1, p. 02005, Jan. 2017, https://doi.org/10.1063/1.4981194
-
Shalaan A. M. Alshammari, Mostafa M. Makrahy, and Nouby M. Ghazaly, “Fault diagnosis of helical gear through various vibration techniques in automotive gearbox,” Journal of Mechanical Design and Vibration, Vol. 7, No. 1, pp. 21–26, Jul. 2019, https://doi.org/10.12691/jmdv-7-1-3
-
N. Barbieri, G. de Sant’Anna Vitor Barbieri, B. M. Martins, L. de Sant’Anna Vitor Barbieri, and K. F. de Lima, “Analysis of automotive gearbox faults using vibration signal,” Mechanical Systems and Signal Processing, Vol. 129, pp. 148–163, Aug. 2019, https://doi.org/10.1016/j.ymssp.2019.04.028
-
E. Tomeh, “An influence of the load on the car gearbox noise,” in 25th International Conference Engineering Mechanics, 2019.
-
I. Bhavi, G. V. Patil, and V. V. Kuppast, “Early detection of failure of spiral bevel gears used in differential gearbox,” Journal of Failure Analysis and Prevention, Vol. 21, No. 4, pp. 1189–1194, May 2021, https://doi.org/10.1007/s11668-021-01163-1
-
S. Sann and E. Tomeh, “Detection and localization the sources of vibration and noise on car gearbox by using frequency analysis,” in 48th International Conference of Departments of Transport, Handling, Construction and Agricultural Machinery, 2022.
-
Z. Shen, Q. Xie, F. Jiang, and Y. Huang, “Vibration Fault detection of vehicle transmission gearbox based on time-frequency analysis of non-stationary signals,” International Journal of Vehicle Design, Vol. 89, No. 1/2, p. 145, Jan. 2022, https://doi.org/10.1504/ijvd.2022.128028
-
M. K. Singh, S. Kumar, and D. Nandan, “Faulty voice diagnosis of automotive gearbox based on acoustic feature extraction and classification technique,” Journal of Engineering Research, Vol. 11, No. 2, p. 100051, Jun. 2023, https://doi.org/10.1016/j.jer.2023.100051
-
“Reilhofer, delta-ANALYSER v2: Manual deltaANALYSER v2,” Karlsfeld, Germany: Reilhofer KG, 2016.
-
“Reilhofer, delta-ANALYSER v2: Manual Evaluation.NET,” Karlsfeld, Germany: Reilhofer KG, 2016.
-
“Reilhofer Order Calculator: Manual Reilhofer Order Calculator (ROC),” Karlsfeld, Germany: Reilhofer KG, 2015.
-
“KISSsoft: Release 2023: User Manual,” Bubikon, Switzerland: KISSsoft, 2023.
-
T. Marek and P. Nemecek, “Transmission Error and Sound Pressure Level of Spur Gearing with Straight and Helical Teeth,” MM Science Journal, Vol. 2022, No. 4, pp. 6069–6073, Nov. 2022, https://doi.org/10.17973/mmsj.2022_11_2022129
-
J. Tuma, “Measurement and signal processing methods employed for testing car and truck gearboxes,” in The 2nd World Congress on Engineering Asset Management (EAM) and The 4th International Conference on Condition Monitoring, 2010.
-
J. Tuma, “Transmission and gearbox noise and vibration prediction and control,” in Handbook of Noise and Vibration Control, Wiley, 2007, pp. 1086–1095, https://doi.org/10.1002/9780470209707.ch88
-
R. C. Juvinall and K. M. Marshek, Fundamentals of Machine Component Design. Hoboken, NJ: John Wiley & Sons, 2012.
-
S. M. Salunkhe, “Experimental setup for gear fault diagnosis using machine learning,” Interantional Journal of Scientific Research in Engineering and Management, Vol. 6, No. 4, Apr. 2022, https://doi.org/10.55041/ijsrem12651
-
B. El Yousfi, A. Soualhi, K. Medjaher, and F. Guillet, “New approach for gear mesh stiffness evaluation of spur gears with surface defects,” Engineering Failure Analysis, Vol. 116, p. 104740, Oct. 2020, https://doi.org/10.1016/j.engfailanal.2020.104740
-
O. Asi, “Fatigue failure of a helical gear in a gearbox,” Engineering Failure Analysis, Vol. 13, No. 7, pp. 1116–1125, Oct. 2006, https://doi.org/10.1016/j.engfailanal.2005.07.020
-
R. G. Budynas, J. K. Nisbett, and J. E. Shigley, “Shigley’s mechanical engineering design,” in Mcgraw-Hill series in mechanical engineering, New York: McGraw-Hill Education, 2015.
-
A. Ratni and D. Benazouz, “Mathematical modelling of rolling element bearings fault for the diagnosis in the gearbox-induction machine,” Mathematical Models in Engineering, Vol. 6, No. 1, pp. 1–12, Mar. 2020, https://doi.org/10.21595/mme.2020.21206
-
M.-H. Evans, “An updated review: white etching cracks (wecs) and axial cracks in wind turbine gearbox bearings,” Materials Science and Technology, Vol. 32, No. 11, pp. 1133–1169, Jul. 2016, https://doi.org/10.1080/02670836.2015.1133022
-
D. Wang, P. W. Tse, and K. L. Tsui, “An enhanced kurtogram method for fault diagnosis of rolling element bearings,” Mechanical Systems and Signal Processing, Vol. 35, No. 1-2, pp. 176–199, Feb. 2013, https://doi.org/10.1016/j.ymssp.2012.10.003
-
G. He, J. Li, K. Ding, and Z. Zhang, “Feature extraction of gear and bearing compound faults based on vibration signal sparse decomposition,” Applied Acoustics, Vol. 189, p. 108604, Feb. 2022, https://doi.org/10.1016/j.apacoust.2021.108604
-
B. Eftekharnejad, A. Addali, and D. Mba, “Shaft crack diagnostics in a gearbox,” Applied Acoustics, Vol. 73, No. 8, pp. 723–733, Aug. 2012, https://doi.org/10.1016/j.apacoust.2012.02.004
-
B. K., D. G., J. Paul, R. S., and G. Jamadade, “Analysis of automotive transmission gearbox synchronizer wear due to torsional vibration and the parameters influencing wear reduction,” Engineering Failure Analysis, Vol. 105, pp. 427–443, Nov. 2019, https://doi.org/10.1016/j.engfailanal.2019.06.084
-
B. Xu, Y. Qiu, B. Yin, X. Hua, and H. Du, “Influence of different modified gears on the vibration and noise of electric vehicle reducer,” The International Journal of Acoustics and Vibration, Vol. 26, No. 4, pp. 325–336, Dec. 2021, https://doi.org/10.20855/ijav.2021.26.41824
-
E. Tomeh, Technical Diagnostics: Vibration Diagnostics of Machines and Equipment. Liberec: Technical University of Liberec, 2015, https://doi.org/10.1007/978-3-319-44087-3_33.pdf
-
B. Peng, Y. Bi, B. Xue, M. Zhang, and S. Wan, “A survey on fault diagnosis of rolling bearings,” Algorithms, Vol. 15, No. 10, p. 347, Sep. 2022, https://doi.org/10.3390/a15100347
-
M.-K. Liu and P.-Y. Weng, “Fault diagnosis of ball bearing elements: a generic procedure based on time-frequency analysis,” Measurement Science Review, Vol. 19, No. 4, pp. 185–194, Aug. 2019, https://doi.org/10.2478/msr-2019-0024
-
T. Wang, M. Liang, J. Li, and W. Cheng, “Rolling element bearing fault diagnosis via fault characteristic order (FCO) analysis,” Mechanical Systems and Signal Processing, Vol. 45, No. 1, pp. 139–153, Mar. 2014, https://doi.org/10.1016/j.ymssp.2013.11.011
-
S. A. Mcinerny and Y. Dai, “Basic vibration signal processing for bearing fault detection,” IEEE Transactions on Education, Vol. 46, No. 1, pp. 149–156, Feb. 2003, https://doi.org/10.1109/te.2002.808234
-
P. Večeř, M. Kreidl, and R. Šmíd, “Condition indicators for gearbox condition monitoring systems,” Acta Polytechnica, Vol. 45, No. 6, Jan. 2005, https://doi.org/10.14311/782
-
J. Prakash Kumar, P. S. Chauhan, and P. Prakash Pandit, “Time domain vibration analysis techniques for condition monitoring of rolling element bearing: a review,” Materials Today: Proceedings, Vol. 62, pp. 6336–6340, Jan. 2022, https://doi.org/10.1016/j.matpr.2022.02.550
-
“SKF @ptitude Analyst for SKF Microlog Analyzer: User Manual,” SKF USA Inc., 2016.
-
A. Fernandez, “Troubleshooting of Gears,” https://power-mi.com/content/troubleshooting-gears
-
A. Fernandez, “Frequencies of a Gear Assembly,” https://power-mi.com/content/frequencies-gear-assembly
-
D. Zhao, L. Gelman, F. Chu, and A. Ball, “Vibration health monitoring of rolling bearings under variable speed conditions by novel demodulation technique,” Structural Control and Health Monitoring, Vol. 28, No. 2, Nov. 2020, https://doi.org/10.1002/stc.2672
-
L. Zhen, H. Zhengjia, Z. Yanyang, and C. Xuefeng, “Bearing condition monitoring based on shock pulse method and improved redundant lifting scheme,” Mathematics and Computers in Simulation, Vol. 79, No. 3, pp. 318–338, Dec. 2008, https://doi.org/10.1016/j.matcom.2007.12.004
-
A. Fernandez, “Typical bearing defects and spectral identification,” https://power-mi.com/content/typical-bearing-defects-and-spectral-identification
-
Y. Hu, X. Tu, F. Li, H. Li, and G. Meng, “An adaptive and tacholess order analysis method based on enhanced empirical wavelet transform for fault detection of bearings with varying speeds,” Journal of Sound and Vibration, Vol. 409, pp. 241–255, Nov. 2017, https://doi.org/10.1016/j.jsv.2017.08.003
-
Y. Guo, T.-W. Liu, J. Na, and R.-F. Fung, “Envelope order tracking for fault detection in rolling element bearings,” Journal of Sound and Vibration, Vol. 331, No. 25, pp. 5644–5654, Dec. 2012, https://doi.org/10.1016/j.jsv.2012.07.026
-
A. Nandi and H. Ahmed, “Condition monitoring with vibration signals,” in Compressive Sampling and Learning Algorithms for Rotating Machine, Wiley, 2019, https://doi.org/10.1002/9781119544678
-
A. Brandt, Noise and Vibration Analysis: Signal Analysis and Experimental Procedures. Wiley, 2011, https://doi.org/10.1002/9780470978160.fmatter
-
Z. Feng, M. Liang, and F. Chu, “Recent advances in time-frequency analysis methods for machinery fault diagnosis: a review with application examples,” Mechanical Systems and Signal Processing, Vol. 38, No. 1, pp. 165–205, Jul. 2013, https://doi.org/10.1016/j.ymssp.2013.01.017
-
N. Barbieri, G. de Sant’Anna Vitor Barbieri, B. M. Martins, and L. de Sant’Anna Vitor Barbieri, “Damage analysis in automotive gearbox,” Procedia Engineering, Vol. 199, pp. 1858–1863, Jan. 2017, https://doi.org/10.1016/j.proeng.2017.09.113
-
B. M. Martins and G. S.A. V. Barbieri, “Quality control of automotive gearbox based on vibration signal analysis,” Zenodo, Vol. 9, No. 6, May 2015, https://doi.org/10.5281/zenodo.1106189
-
L. Zhang, J. Xu, J. Yang, D. Yang, and D. Wang, “Multiscale morphology analysis and its application to fault diagnosis,” Mechanical Systems and Signal Processing, Vol. 22, No. 3, pp. 597–610, Apr. 2008, https://doi.org/10.1016/j.ymssp.2007.09.010
-
Q. Chen, Z. Chen, W. Sun, G. Yang, A. Palazoglu, and Z. Ren, “A new structuring element for multi-scale morphology analysis and its application in rolling element bearing fault diagnosis,” Journal of Vibration and Control, Vol. 21, No. 4, pp. 765–789, Jul. 2013, https://doi.org/10.1177/1077546313486163
-
P. Weis, Kučera, P. Pecháč, and M. Močilan, “Modal analysis of gearbox housing with applied load,” Procedia Engineering, Vol. 192, pp. 953–958, Jan. 2017, https://doi.org/10.1016/j.proeng.2017.06.164
-
D. Marano, L. Pascale, J. Langhart, S. Ebrahimi, and T. Giese, “NVH analysis and simulation of automotive E-Axles,” Geartechnology, 2021.
-
Duan Nengquan, Cai Xuanming, and Wang Junyuan, “Dynamic characteristics of automobile gearbox of simulation and experimental research,” in 2011 Cross Strait Quad-Regional Radio Science and Wireless Technology Conference (CSQRWC), pp. 1700–1703, Jul. 2011, https://doi.org/10.1109/csqrwc.2011.6037304
-
A. Kumar and P. P. Patil, “Modal analysis of heavy vehicle truck transmission gearbox housing made from different materials,” Journal of Engineering Science and Technology, Vol. 11, No. 2, pp. 252–266, 2016.
-
M. E. Morsy and G. Achtenová, “Vehicle gearbox fault diagnosis based on cepstrum analysis,” International Journal of Computer and Information Engineering, Vol. 8, No. 9, pp. 1577–1583, 2014.
-
A. Smith, J. Pears, M. Platten, D. Palmer, and Y. Hirabayashi, “Epicyclic gear transmission error – the importance of controlling tolerances,” in SAE 2007 Noise and Vibration Conference and Exhibition, pp. 2007–1, May 2007, https://doi.org/10.4271/2007-01-2241
-
Z. Qin, Y.-T. Wu, and S.-K. Lyu, “A review of recent advances in design optimization of gearbox,” International Journal of Precision Engineering and Manufacturing, Vol. 19, No. 11, pp. 1753–1762, Nov. 2018, https://doi.org/10.1007/s12541-018-0203-z
-
C. J. Li and S. M. Wu, “On-line detection of localized defects in bearings by pattern recognition analysis,” Journal of Engineering for Industry, Vol. 111, No. 4, pp. 331–336, Nov. 1989, https://doi.org/10.1115/1.3188768
-
M. Van, H.J. Kang, and K.S. Shin, “Rolling element bearing fault diagnosis based on non‐local means de‐noising and empirical mode decomposition,” IET Science, Measurement and Technology, Vol. 8, No. 6, pp. 571–578, Nov. 2014, https://doi.org/10.1049/iet-smt.2014.0023
-
M. Cerrada et al., “A review on data-driven fault severity assessment in rolling bearings,” Mechanical Systems and Signal Processing, Vol. 99, pp. 169–196, Jan. 2018, https://doi.org/10.1016/j.ymssp.2017.06.012
-
E. Tomeh, Diagnostic Methodology of Rolling Element and Journal Bearings. Liberec: Technical University of Liberec, 2007, https://doi.org/10.1007/978-3-319-44087-3_33.pdf
-
P. Gupta and M. K. Pradhan, “Fault detection analysis in rolling element bearing: a review,” Materials Today: Proceedings, Vol. 4, No. 2, pp. 2085–2094, Jan. 2017, https://doi.org/10.1016/j.matpr.2017.02.054
-
M. Dosedeˇl, “A comparison of methods for the bearing state evaluation,” in 25st Conference Student EEICT 2019, 2019.
-
M. K. Pradhan and P. Gupta, “Fault detection using vibration signal analysis of rolling element bearing in time domain using an innovative time scalar indicator,” International Journal of Manufacturing Research, Vol. 12, No. 3, p. 305, Jan. 2017, https://doi.org/10.1504/ijmr.2017.086175
-
R. B. Randall and J. Antoni, “Rolling element bearing diagnostics-a tutorial,” Mechanical Systems and Signal Processing, Vol. 25, No. 2, pp. 485–520, Feb. 2011, https://doi.org/10.1016/j.ymssp.2010.07.017
-
M. Lebold, K. Mcclintic, R. Campbell, C. Byington, and K. Maynard, “Review of vibration analysis methods for gearbox diagnostics and prognostics,” in 54th Meeting of the Society for Machinery Failure Prevention Technology, 2000.
About this article

The authors have not disclosed any funding.
The datasets generated during and/or analyzed during the current study are available from the corresponding author on reasonable request.
Samnang Sann: conceptualization, formal analysis, methodology, project administration, resources, validation, visualization, writing-original draft preparation, writing-review and editing. Elias Tomeh: supervision, validation, writing-original draft preparation, writing-review and editing. Tomas Petr: validation, writing-original draft preparation, writing-review and editing.
The authors declare that they have no conflict of interest.
