Abstract
This paper mainly focuses on the numerical calculation to determine the vertical evaluation indexes with all three types of typical harmonic, transient and random road excitations. The effects of linear and nonlinear suspension characteristics on the vertical evaluation indexes are fully understood systematically. The ride comfort, suspension working space, and road holding are analyzed for both two cases of linear and nonlinear suspension systems. The improvement of the vertical stability and road holding in the case of nonlinear suspension subjected under three different excitations could be characterized most meaningfully. The obtained results help to systematically get full understanding of the investigated problem nature. It also should guide interested readers in suspension design to improve the stability, safety, and ride comfort of buses.
1. Introduction
Public transport, including buses, plays an important role in contributing to reduce traffic jams in big cities, especially in developing countries like Vietnam today. With the increasing number of domestically designed and manufactured buses, improving the quality is always an urgent need, especially the improvement of ride comfort, safety, and dynamic stability in operation. Many research efforts to improve the bus ride comfort have been carried out [1, 2]. A multi body dynamic model is employed to determine the bus oscillation zones subjected under poor and good road excitation [1]. The ride comfort for the zones of driver, middle part and rear of a bus is determined by a 10DOF bus model [2].
Vehicle suspension plays a very important role in improving ride comfort and road holding, studies evaluating the influence of suspension parameters on ride comfort and road holding have been carried out using simulation models. Various simulations in which linear, semi-active and active suspension systems are employed incorporating suspension control techniques. [3, 4]. A linear 3DOF quarter-car model is employed to investigate the effects of the spring stiffness and shock absorber damping of a bus on the vertical acceleration, suspension deformation and dynamic wheel load [3]. To address the complicated devices for controlling variable stiffness, a semi-active suspension, in which a new configuration using two controllable dampers and two constant springs is proposed [4]. Although, passive, semi-active and active suspension systems still have the gap among of them. However, they represent a compromise between performance improvement and simplicity of implementation.
Air springs are also used in the design of buses to replace conventional leaf springs. Many studies of air spring models, the effects of air springs on vehicle dynamics have been carried out, recently [5, 6]. The vehicle vertical dynamic performances have been investigated by a 2DOF quarter-car model, in which two types of classic and dynamic air spring models are employed [5]. A new dynamic model and analytical expressions of an air spring are proposed for determining the dynamic stiffness of air springs, and verified by experiment under various frequencies and strokes [6]. Shock absorbers also present a very important role of suspension systems. The influences of asymmetric, nonlinear shock absorber types on bus vibration evaluation indexes have also been carried out [7-9]. A haft-car and quarter-car models are employed with two types of symmetric and asymmetric shock absorbers, to investigate the comfort of a passenger car [7]. The effects of an asymmetric shock absorber on the comfort is obtained by a quarter-car model subjected under harmonic excitation [8]. An investigation of asymmetric shock absorber on the ride comfort and road holding is carried out by a quarter-car model subjected under random and transient excitations [9].
With an increasing number of buses designed and manufactured in Vietnam, in which the conventional passive suspension systems are gradually replaced by air spring suspension systems and using asymmetric nonlinear shock absorbers, the research to investigate the differences between the two types of linear and nonlinear suspension systems is really necessary. It contributes to assisting engineers in designing and manufacturing buses to improve ride comfort and dynamic stability. This paper is carried out to get full understanding the different effects on vertical dynamic evaluation indexes of the linear and nonlinear suspension systems, systematically. The obtained results of evaluation indexes for all the excitation cases of harmonic, transient and random show that with nonlinear suspension provides the best road holding and suspension working space. In particular, under transient excitation, in which the vehicle is subjected to sudden load changes, in operation of the vehicle, the dynamic stability is improved. In addition, the working state of the nonlinear suspension is mostly in the state of compression due to the asymmetrical characteristic of the shock absorber, so the lower center of gravity increases the dynamic stability, especially when the vehicle is moving at high speed. The ride comfort with nonlinear suspension is not significantly improved in the low velocity domain, and is almost the same compared to linear suspension. In contrast, at velocities higher than 20 (m/s) the ride comfort with nonlinear suspension is significantly reduced compared with linear suspension.
2. Research method
2.1. Simulation model
2.1.1. The quarter-car dynamic 2DOF model
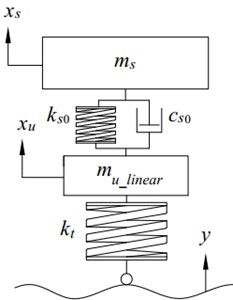
The quarter-car vertical dynamic 2DOF model with two types of linear and nonlinear suspension systems is employed to determine the vertical dynamic evaluation indexes of a bus, Fig. 1.
Fig. 1The quarter-car dynamic 2DOF model: a) linear, b) nonlinear
a)
b)
The model allows to determine the vertical dynamic evaluation indexes of the ride comfort, suspension working space, and road holding. The model consists of two elements of an un-sprung mass and a sprung mass, all moving vertically. The excitations are considered for all three types of harmonic, transient and random.
The symbols and input calculation parameters are determined and selected based on a typical bus in Vietnam. The symbols and the meaning of the quarter-car dynamic 2DOF model parameters are given in Table 1.
Table 1The 2DOF dynamic model parameters
Symbol | Description | Unit | Value |
Un-sprung mass in the case of linear suspension system | (kg) | 250 | |
Un-sprung mass in the case of nonlinear suspension system | (kg) | 200 | |
Sprung mass | (kg) | 2000 | |
Tire stiffness | (N/m) | 1000000 | |
Initial air spring stiffness | (N/m) | 59250 | |
Initial damping coefficient | (Ns/m) | 6500 | |
Harmonic, transient, or random excitation | (m) | – | |
Vertical displacement of the un-sprung mass | (m) | – | |
Vertical displacement of the sprung mass | (m) | – |
The differential equation describing vertical dynamic motion, with a vector of state variables, is written in matrix form, Eq. (1):
The mass matrix [], in which the un-sprung mass in the case of nonlinear suspension has a value reduced by 20 % compared with the case of the linear suspension, Table 1. The stiffness matrix [] with instantaneous nonlinear air spring stiffness is used in the case of nonlinear suspension. In the case of linear suspension, the spring stiffness is selected as the air spring stiffness at the initial equilibrium position , [11].
The damping matrix [] with instantaneous damping coefficient of the asymmetrical nonlinear shock absorber is used in the case of nonlinear suspension. In the case of linear suspension, the damping coefficient is selected as the initial damping coefficient 6500 (Ns/m), corresponding to the damping ratio value 0.3, [10, 12].
The excitation force vectors [] are in the form of harmonic, transient, and random. The matrices included in the general dynamic equation are presented as follows, [9, 10]:
With linear suspension case:
With nonlinear suspension case:
2.1.2. Spring stiffness
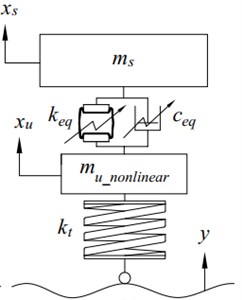
The nonlinear suspension system includes an air spring, the corresponding stiffness, by 3rd order polynomial interpolation based on the calculated instantaneous displacement value relative to the initial equilibrium position of the air spring corresponding to its extension or compression stroke [11]. The characteristic curves of the experimental stiffness and the interpolated ones according to the 3rd order polynomial versus the displacement around the equilibrium position is shown in Fig. 2. For a linear suspension, the spring stiffness parameter is selected as the air spring stiffness value at the initial equilibrium position , which is equivalent to a natural frequency close to 1 (Hz), the usual natural frequency of common vehicles’ suspension systems [12]. The limited working stroke of the air spring is ±0.1 (m).
Fig. 2Equivalent stiffness versus displacement of the air spring, experimental and polynomial interpolation
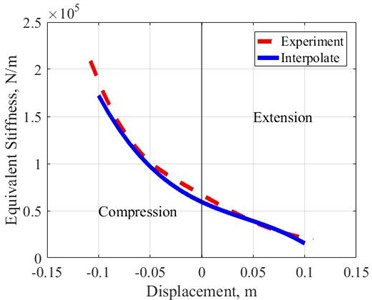
Fig. 3Variation characteristics of the equivalent damping force versus velocity
2.1.3. Damping coefficient
The Nonlinear Asymmetric (NA) shock absorber model is employed to perform the calculation, [10, 11]. In the initial condition, the equivalent damping coefficient is equal to , when the damping force is equal to zero, 0. When the system is subjected to an external applied loading, 0, is determined by the equivalent damping force , suspension relative velocity, and the shock absorber’s state of stroke. The selected asymmetry coefficient corresponding to the asymmetry ratio of 30/70 is 0.4, [13]. The equivalent damping coefficient changes when the relative velocity reaches the knee-point critical value 0.05 (m/s), with coefficients 1, 2. The equivalent damping force is calculated according to Eq. (2), [10, 11]:
The characteristic curves of equivalent damping force, versus the relative velocity , for the case of linear and nonlinear shock absorbers, are shown in Fig. 3.
2.2. Road excitations
A sinusoidal function of time is employed to describe the harmonic excitation, Eq. (3), [14]:
The bump length and the bump height , are chosen to be equal to 1 (m) and 0.005 (m), respectively. The excitation frequency is considered in the common range of 0.5-30 (Hz), [10].
A semi-squared sinusoidal function is employed to describe the transient excitation, Eq. (4), [15]:
With the bump length 3.7 (m), the bump height 0.1 (m).
The random road profiles according to ISO-8608 [16, 17], the calculation is performed with the class of good grade A, with parameters selected according to the range of frequency from 0.5 to 50 (Hz); and 2. The random road profile with a length of 100 (m), the number of sine waves is chosen 256. The velocity is considered in the range of 5-120 (km/h).
2.3. Evaluation indexes
The evaluation indexes are determined and analyzed in the frequency and velocity domains of harmonic, transient and random excitations, respectively. Evaluation indexes of the Body Vibration Acceleration (BVA), Suspension Dynamic Deflection (SDD), and Tire Dynamic Load (TDL) could be determined as gain response (G), maximum (M), or Root Mean Square (R), depending on the type of excitation.
2.3.1. Body vibration acceleration – BVA
The gain response of BVA index in the case of harmonic excitation is defined as the ratio of the acceleration amplitude to the applied acceleration amplitude, [10, 14], according to Eq. (5):
Under transient excitation, the maximum of BVA in the time domain is determined by Eq. (6), [18]:
Under random excitation, the ISO-2631 is employed to account for frequency-weighted effects, [19]. The RMS of the frequency weighted acceleration is defined by Eq. (7), [20]:
2.3.2. Suspension dynamic deflection – SDD
The gain response of SDD index in the case of harmonic excitation is defined as the ratio of the relative displacement amplitude to the applied amplitude, [14], Eq. (8):
The maximum of SDD index in the time domain is determined in the case of transient excitation, Eq. (9), [18]:
In the case of a random excitation, the RMS of SDD is determined by Eq. (10), [20]:
2.3.3. Tire dynamic load – TDL
The maximum TDL index is determined in both the case of harmonic and transient excitations, Eq. (11), [18]:
In the case of the random excitation, the RMS of TDL is determined by Eq. (12), [20]:
3. Calculation flowchart
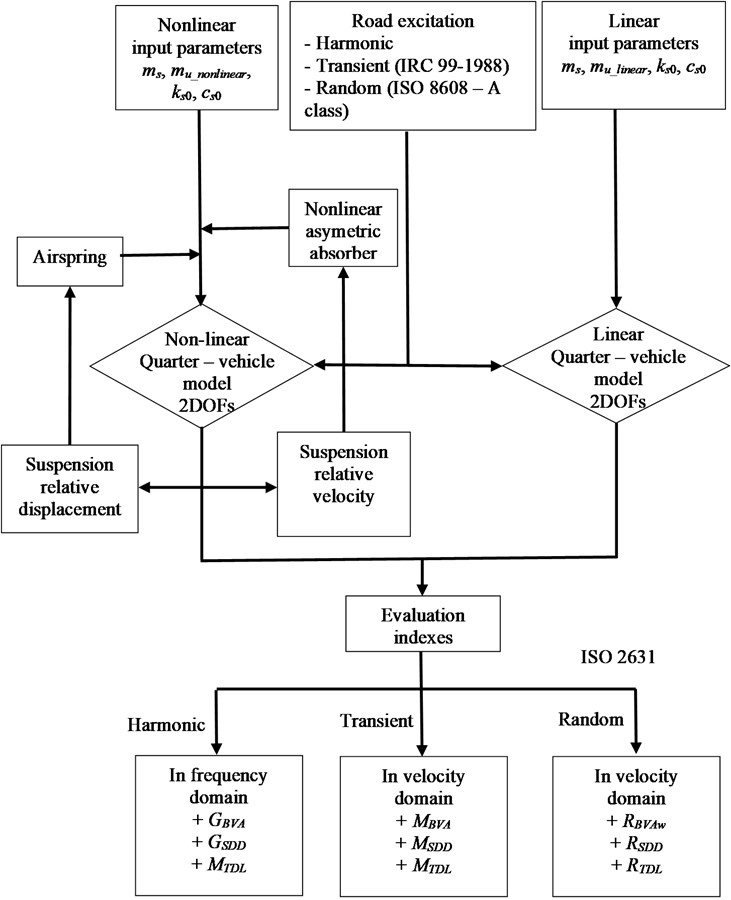
To analyse the evaluation indexes of the bus vertical dynamic performances in two cases of linear and nonlinear suspension systems, the calculation flowchart is presented in Fig. 4. The Matlab’s tool for numerically solving ordinary differential equations, in which the solver ode45 is employed to solve the dynamic Eq. (1). Calculations are performed with both the linear and nonlinear suspension systems, in which the linear suspension parameters are constant chosen as the initial values of the nonlinear suspension. The air spring stiffness and the equivalent damping coefficient of nonlinear suspension are determined respectively according to the relative displacement and velocity of the suspension and depend on the state of extension or compression. Three types of excitations are considered as: harmonic, transient, and random. The vertical dynamic evaluation indexes of the bus including ride comfort, suspension working space, and road holding are analysed in both linear and nonlinear suspension systems.
4. Results and discussions
4.1. Harmonic excitation
4.1.1. BVA
Under harmonic excitation, the in the frequency domain is determined by Eq. (5), Fig. 5. At the natural frequency of the suspension, the obtained reach the peak values. The peak value with nonlinear suspension is less about 10 % than that of the linear suspension. Because the nonlinear suspension has a higher damping coefficient in the low velocity region corresponding to low frequencies, [10].
Outside the suspension resonant frequency range, the values of the two types of suspension systems are almost equal. In addition, in the frequency region higher than 5 (Hz), especially at the frequency around 11 (Hz) which is the resonance region of the tire, the with nonlinear suspension is slightly less than the linear one. Therefore, the nonlinear suspension helps to improve the ride comfort at the resonance frequencies of both the suspension and tire.
Fig. 4Calculation flowchart
4.1.2. SDD
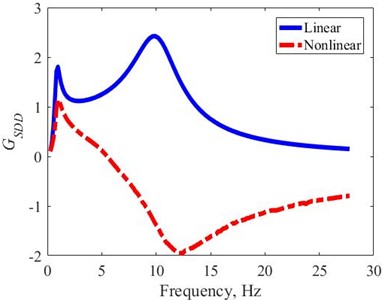
The are determined by Eq. (8) and shown in the frequency domain, Fig. 6. The obtained with linear suspension is always positive and reaches the two peaks at the corresponding resonances of the suspension and tire natural frequencies. The natural frequency of a tire with a nonlinear suspension is slightly higher than that of a linear suspension. Because the unsprung mass of the nonlinear suspension is 20 % less than that of the linear suspension. However, the obtained with nonlinear suspension has a positive value at the resonance of suspension and is much lower than that of a linear suspension. In addition, when the excitation frequency is larger than 5 (Hz), the decreases rapidly and has a negative value. At the resonant frequency of the tire, the reaches the second peak. Due to the asymmetrical characteristic of the nonlinear suspension, both of damping coefficient and spring stiffness are lower in the state of compression. The asymmetry around the zero axis of the suspension relative displacement causes the big difference in the between the linear and nonlinear suspension systems as shown in Fig. 6, [10]. Therefore, the nonlinear suspension is in a compressed state when the excitation frequency is larger than 5 (Hz), corresponding to the vehicle’s center of gravity tends to lower, increasing the dynamic stability in operation.
Fig. 5Gain response of BVA in the frequency domain – harmonic excitation
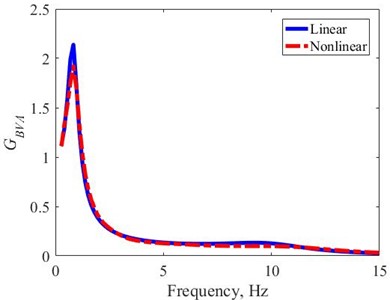
Fig. 6Gain response of SDD in the frequency domain – harmonic excitation
The dynamic working stroke of the nonlinear suspension is asymmetric around the initial equilibrium position. To compare the suspension dynamic deflection stroke (SDDS) of linear and nonlinear suspension, the gain response of SDDS is defined by Eq. (13):
The obtained in the frequency domain, Fig. 7, shows that the two peaks at the two corresponding resonant frequencies are always smaller than with the nonlinear suspension. In addition, with nonlinear suspension is always less, when the excitation frequency is less than 11 (Hz). Conversely, with nonlinear suspension is larger when the excitation frequency is larger than 11 (Hz). Therefore, with the higher excitation frequency, with the nonlinear suspension will be higher than that of the linear suspension and vice versa.
4.1.3. TDL
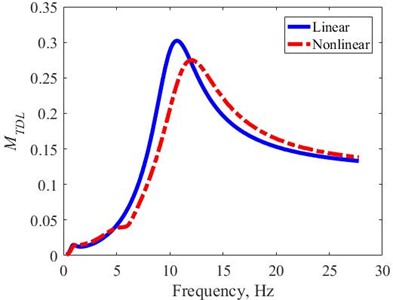
The obtained in the frequency domain under the harmonic excitation is determined by Eq. (11), Fig. 8. The obtained allows to evaluate the road holding feature of the vehicle, the larger the the lower the road holding or the vehicle will have less stability. The reaches its peak at the natural frequency resonant of the tire, with the nonlinear suspension having the peak reduced by 7 % compared to the linear suspension. Furthermore, the peak of is obtained at higher frequency with nonlinear suspensions, since the unsprung mass is 20 % less than with linear suspensions. When the excitation frequency is less than 11 (Hz), the obtained with nonlinear suspension is always smaller than with linear suspension. Conversely, when the excitation frequency is larger than 11 (Hz), the obtained with nonlinear suspension is slightly larger than with linear suspension.
In summary, under the harmonic excitation with a frequency less than about 11 (Hz), which is the natural frequency of the tire, with nonlinear suspension, we always obtain the better corresponding acceleration, displacement, and TDL indexes, which are used to evaluate the vertical dynamic performance of ride comfort, suspension working space, and road holding. Especially, the peaks of these evaluation indexes at the resonance of the suspension and tire natural frequencies are always significantly smaller than those of the linear suspension. However, in contrast, in the excitation frequency domain larger than 11 (Hz), the obtained evaluation indexes show that the linear suspension gives slightly better results than the nonlinear suspension.
Fig. 7Gain response of SDDS in the frequency domain – harmonic excitation
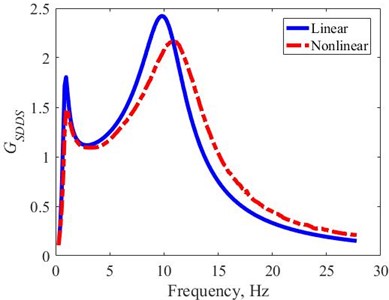
Fig. 8MTDL in the frequency domain – harmonic excitation
4.2. Transient excitation
4.2.1. BVA
The obtained under transient excitation in the velocity domain is determined by Eq. (6), Fig. 9. The obtained results show that the increases linearly in the velocity domain, and for nonlinear suspension is always slightly larger than linear suspension. Therefore, the ride comfort of the bus with the linear suspension is slightly better than that of the nonlinear suspension. In the velocity domain larger than 20 (m/s), the obtained show that the linear suspension gives rapidly better results than the nonlinear suspension.
Fig. 9MBVA in the velocity domain – transient excitation
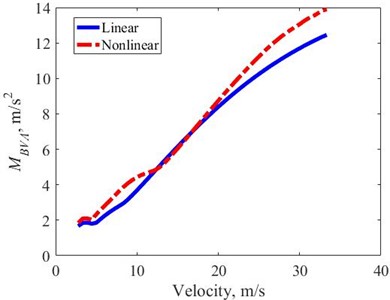
Fig. 10MSDD in the velocity domain – transient excitation
4.2.2. SDD
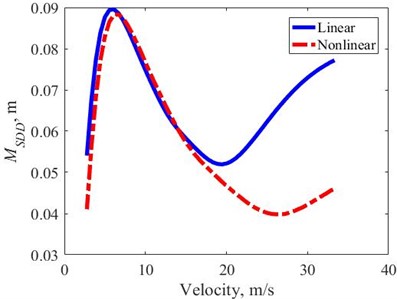
The obtained under transient excitation, in the velocity domain is defined in terms of Eq. (9), Fig. 10. The results show that increases rapidly with velocity and reaches a large value in the velocity range from 5-10 (m/s), then decreases rapidly in the velocity range from 10-20 (m/s), and in the velocity range from 5-15 (m/s) the obtained is almost equal with two types of linear and nonlinear suspension. In contrast, when the velocity is greater than 20 (m/s), the with the nonlinear suspension continues to decrease rapidly and increase slightly when the velocity reaches 25 (m/s). The increases rapidly with the linear suspension, at the velocity 33 (m/s), the with linear suspension is 67 % larger than that of the nonlinear suspension.
Therefore, as subjected under transient excitation in the type of IRC, the obtained with two types of nonlinear and linear suspension systems are almost equal at velocity values less than 20 (m/s). However, in contrast to the velocity domain greater than 20 (m/s), with nonlinear suspension is much smaller than linear suspension. With nonlinear suspension, the evaluation index of suspension working space is much better than linear suspension. It means that the dynamic stability increases significantly under sudden changes in the applied loadings [11].
Similar to Section 4.1.2, the working stroke of the nonlinear suspension is asymmetric around the initial equilibrium position. In order to be able to compare suspension dynamic deflection stroke (SDDS) of linear and nonlinear suspensions under transient excitation, the SDDS is defined by Eq. (14). In the Fig. 11, the obtained SDDS with nonlinear suspensions is always smaller than linear ones, at maximum velocity up to 16 % smaller value. Therefore, under the effect of transient excitation, the nonlinear suspension system has a better suspension working space evaluation index than the linear system.
Fig. 11SDDS in the velocity domain – transient excitation
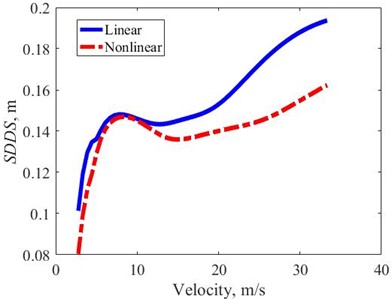
Fig. 12MTDL in the velocity domain – transient excitation
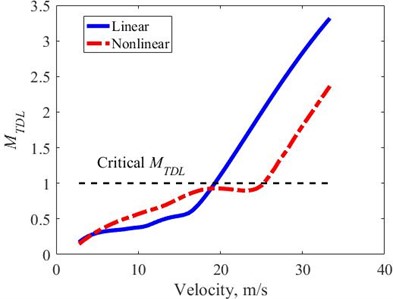
4.2.3. TDL
The obtained under transient excitation is determined by Eq. (11), Fig. 12. The helps to evaluate the road holding feature of the vehicle, the larger the the lower the road holding feature. The critical value of is equal to 1, the wheel is no longer hold to the road surface, correspondingly. The results show that, in the velocity domain less than 20 (m/s), the obtained with both linear and nonlinear suspension systems has a value of less than 1, or the wheel is still hold to the road, and with linear suspension is always slightly smaller than nonlinear suspension, or wheels have better road holding with linear suspension in the low velocity range. However, reaches its critical value earlier with linear suspension at velocity close to 20 (m/s), whereas with nonlinear suspension reaches its critical value at higher velocity of about 25 (m/s). Thus, with the nonlinear suspension the velocity value at which the reaches its critical point is larger than that of the linear suspension. With the nonlinear suspension system, the road holding feature has been improved, in particular, the critical velocity of road holding is increased compared to the case of a suspension with only asymmetric shock absorber [9].
4.3. Random excitation
4.3.1. BVA
The obtained under the excitation of random class A is determined by Eq. (7), in which the includes frequency weighting according to ISO-2631, Fig. 13. The results show that, for both linear and nonlinear suspension systems, the obtained are all smaller than the fairly uncomfortable level, 0.63 (m/s2) according to the ISO-2631 standard, in the entire observed velocity domain. In the velocity range from 10-25 (m/s), has a larger value than the rest of the velocity range. When the velocity is less than 20 (m/s), the with the two types of suspension is almost the same. However, when the velocity is larger than 20 (m/s), the obtained with nonlinear suspension is about 40 % on average larger than with linear suspension. Therefore, ride comfort with both suspension types is almost the same in the low velocity domain, and ride comfort is significantly better with linear suspension in the velocity range larger than 20 (m/s).
Fig. 13RBVAw in the velocity domain – random excitation
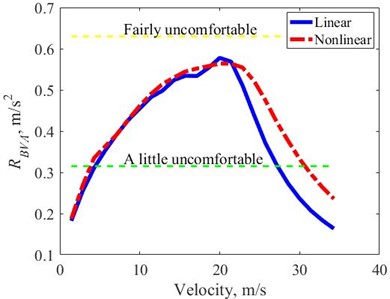
Fig. 14RSDD in the velocity domain – random excitation
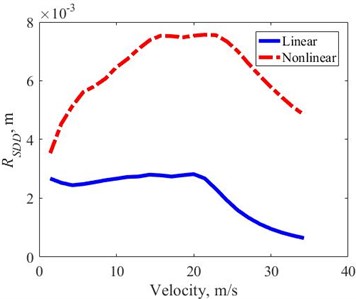
4.3.2. SDD
The obtained under random excitation is determined by Eq. (10), Fig. 14. The results show that the obtained with nonlinear suspension is much larger than with linear suspension in the whole observed velocity domain. However, under random excitation, the road bump amplitude is not high compared to the case of transient excitation. Therefore, in general, it can be seen that with nonlinear suspension, the index is not quite enough to be used to evaluate the suspension working space feature as the obtained index in the case of transient excitation in Section 4.2.2 above.
In addition, the nonlinear suspension under road excitation has the working state mostly in the compression state and the working stroke is asymmetric compared to the initial equilibrium position. It causes the big difference in the between the linear and nonlinear suspension systems as shown in Fig. 14. Or the vehicle's center of gravity will be lowered compared to the original during operation on the road. Similar to the Sections 4.1.2 and 4.2.2, in order to be able to compare the SDDS of linear and nonlinear suspension, the RMS of SDDS is defined by Eq. (15), where the RMS is calculated with the parameter being the difference of the relative displacement over time and its mean:
The obtained under random excitation is determined by Eq. (15), where the SDDS is taken into account the asymmetrical working stroke of the nonlinear suspension, Fig. 15. The results show that, the obtained with linear suspension is not changed since the suspension working stroke is symmetric relative to the initial equilibrium position, or the mean of the linear suspension relative displacement is close to zero. With nonlinear suspension, the obtained is slightly smaller than linear suspension in the velocity domain less than 20 (m/s). However, for the velocity domain larger than 20 (m/s), the obtained with the nonlinear suspension is slightly larger than that of the linear suspension, similar to the obtained results of , as in Fig. 13.
Therefore, under random excitation, a bus with a nonlinear suspension will have a slightly lower center of gravity and a slightly smaller working stroke than a linear suspension in the low velocity region. And conversely, in the velocity domain larger than 20 (m/s), the nonlinear suspension will have an average working stroke up to about 65 % larger than the linear suspension. Generally, the suspension working space evaluation index of the nonlinear suspension is slightly better than that of the linear suspension in the low velocity domain. However, in contrast in the velocity domain larger than 20 (m/s), the suspension working space evaluation index is significantly better with linear suspension.
Fig. 15RSDDS in the velocity domain – random excitation
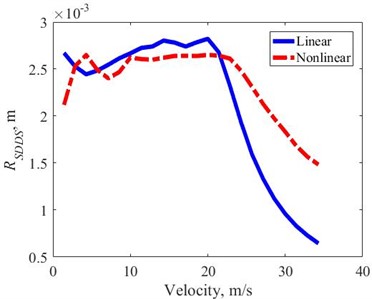
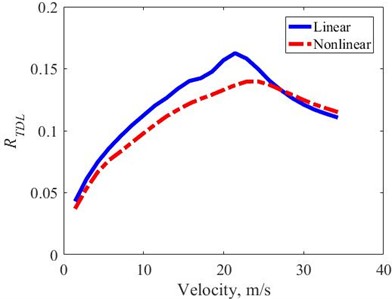
Fig. 16RTDL in the velocity domain – random excitation
4.3.3. TDL
The obtained , under random excitation is determined by Eq. (12), Fig. 16. The results show that the obtained with the nonlinear suspension is always about 8 % better on average than the linear suspension in the whole observed velocity domain. The maximum of are achieved with linear suspension at 20 (m/s), and with nonlinear suspension at 25 (m/s). The two velocity values, at which the maximum are obtained with both types of suspensions, are respectively equal to the two values of the critical velocity under transient excitation, Fig. 12. Thus, the road holding with nonlinear suspension improved on average by about 8 % in the lower velocity region, with a larger velocity range than 25 (m/s) this index with both suspension types being the same.
5. Conclusions
Calculations are performed under harmonic, transient and random excitations with two cases of linear and nonlinear suspension systems, in which all the input parameters are in the normal range of common vehicle suspension systems. The evaluation indexes of BVA, SDD, and TDL for each case of applied loading are analyzed to evaluate the features of ride comfort, suspension working space, and road holding. In addition, the evaluation index of SDD is also taken into account the asymmetry of the working stroke of the nonlinear suspension. The obtained numerical results absolutely show that the influences of the suspension system characteristics, specifically the spring stiffness and the damping coefficient of the shock absorber on the vertical dynamic evaluation indexes. It shows that with the nonlinear suspension system, the safety and stability of the bus will be better in the case of sudden changes in the applied loading. The ride comfort index still almost maintains the same at low frequency and velocity domains. In contrast, with the larger excitation frequency or velocity, the linear suspension gives better results of vertical dynamic performance than the nonlinear suspension. The results for each case of excitation are as:
– Harmonic: the with nonlinear suspension is slightly better in the whole observed frequency domain, especially at the resonant frequency of the suspension, it decreases by about 10 %. The and with nonlinear suspension are slightly better than linear suspension in the excitation frequency domain less than the tire resonance frequency, 11 (Hz). However, in contrast to the larger excitation frequency domain, these evaluation indexes are better for linear suspension. The bus with nonlinear suspension will have slightly better suspension working space and road holding performance in the lower frequency domain of the tire's resonant frequency and vice versa in the higher frequency domain.
– Transient: the with both types of suspension are almost equal in the velocity range lower than 20 [m/s], and slightly better with linear suspension in the velocity range larger than 20 (m/s). In general, ride comfort with linear suspension is slightly better than nonlinear suspension especially in high velocity domain. The with nonlinear suspension is always lower in the whole velocity domain. Especially, in the velocity domain larger than 20 (m/s), this evaluation index is about 10 % lower than that of linear suspension. Therefore, the suspension working space performance with nonlinear suspension is always better than linear suspension, and is especially improved by more than 10 % in the velocity domain larger than 20 (m/s). The with nonlinear suspension is slightly larger in the lower velocity domain of 20 (m/s). However, the critical velocity value of only 20 (m/s) is achieved with a linear suspension. While with nonlinear suspension, the archieved critical velocity reaches up to 25 (m/s). It means that the road holding feature is further improved and allows the critical velocity to increase by about 25 % with the nonlinear suspension.
– Random: the is almost equal in the velocity domain less than 20 (m/s). However, for the velocity domain larger than 20 (m/s), this evaluation index increases by about 40 % with a nonlinear suspension compared to a linear suspension. This shows that ride comfort with nonlinear and linear suspension is almost equally achieved in the velocity domain less than 20 (m/s). In particular, with a velocity domain larger than 20 (m/s), ride comfort with nonlinear suspension is significantly reduced by about 40 % compared to linear suspension. The with nonlinear suspension is slightly better than linear suspension in the velocity region lower than 20 (m/s), and conversely the increases significantly to about 65 % on average. Therefore, the suspension working space performance with nonlinear suspension is better than that of linear suspension in the velocity domain lower than 20 (m/s), and quite the opposite in the velocity range larger than 20 (m/s). The shows that the bus's road holding performance is improved by an average of 8 % over the entire range of velocity.
References
-
D. Sekulić, V. Dedović, S. Rusov, A. Obradović, and S. Šalinić, “Definition and determination of the bus oscillatory comfort zones,” International Journal of Industrial Ergonomics, Vol. 53, pp. 328–339, May 2016, https://doi.org/10.1016/j.ergon.2016.04.003
-
D. Sekulić, V. Dedović, S. Rusov, S. Šalinić, and A. Obradović, “Analysis of vibration effects on the comfort of intercity bus users by oscillatory model with ten degrees of freedom,” Applied Mathematical Modelling, Vol. 37, No. 18-19, pp. 8629–8644, Oct. 2013, https://doi.org/10.1016/j.apm.2013.03.060
-
D. Sekulic and V. Dedović, “The effect of stiffness and damping of the suspension system elements on the optimisation of the vibrational behaviour of a bus,” International Journal for Traffic and Transport Engineering, Vol. 1, No. 4, pp. 231–244, 2011.
-
Y. Liu, H. Matsuhisa, and H. Utsuno, “Semi-active vibration isolation system with variable stiffness and damping control,” Journal of Sound and Vibration, Vol. 313, No. 1-2, pp. 16–28, Jun. 2008, https://doi.org/10.1016/j.jsv.2007.11.045
-
M. M. Moheyeldein, A. M. Abd-El-Tawwab, K. A. Abd El-Gwwad, and M. M. M. Salem, “An analytical study of the performance indices of air spring suspensions over the passive suspension,” Beni-Suef University Journal of Basic and Applied Sciences, Vol. 7, No. 4, pp. 525–534, Dec. 2018, https://doi.org/10.1016/j.bjbas.2018.06.004
-
M. Y. Wu, H. Yin, X. B. Li, J. C. Lv, G. Q. Liang, and Y. T. Wei, “A new dynamic stiffness model with hysteresis of air springs based on thermodynamics,” Journal of Sound and Vibration, Vol. 521, p. 116693, Mar. 2022, https://doi.org/10.1016/j.jsv.2021.116693
-
M. Silveira, B. R. Pontes, and J. M. Balthazar, “Use of nonlinear asymmetrical shock absorber to improve comfort on passenger vehicles,” Journal of Sound and Vibration, Vol. 333, No. 7, pp. 2114–2129, Mar. 2014, https://doi.org/10.1016/j.jsv.2013.12.001
-
M. Silveira, P. Wahi, and J. C. M. Fernandes, “Effects of asymmetrical damping on a 2 DOF quarter-car model under harmonic excitation,” Communications in Nonlinear Science and Numerical Simulation, Vol. 43, pp. 14–24, Feb. 2017, https://doi.org/10.1016/j.cnsns.2016.06.029
-
D. D. Le and H. N. Tran, “An investigation of a bus’s ride comfort by using the quarter car model with linear asymmetric damper,” Journal of Vibroengineering, Vol. 25, No. 1, pp. 143–155, Feb. 2023, https://doi.org/10.21595/jve.2022.22811
-
H. N. Tran, F. E. Gunawan, and N. D. Pham, “Influence of a nonlinear asymmetric shock absorber on vibration of a bus subjected to harmonic excitation,” Journal of Vibroengineering, Vol. 26, No. 1, pp. 128–138, Feb. 2024, https://doi.org/10.21595/jve.2023.23404
-
T. Nhan and N. Pham, “Influences of nonlinear suspension on the bus’s roll stability by a lateral dynamic 4-DOF model,” Journal of Applied Engineering Science, Vol. 21, No. 3, pp. 827–836, Jan. 2023, https://doi.org/10.5937/jaes0-42738
-
T. D. Gillespie, Fundamentals of Vehicle Dynamics Software. Warrendale, USA: SEA, 1992.
-
J. C. Dixon, The Shock Absorber Handbook. USA: Wiley, 2007, https://doi.org/10.1002/9780470516430
-
R. N. Jazar, Vehicle Dynamics. Cham: Springer International Publishing, 2017, https://doi.org/10.1007/978-3-319-53441-1
-
“IRC-99-1988, Tentative guidelines on the provision of speed breakers for control of vehicular speeds on minor roads,” in The Indian Roads Congress, 1988.
-
“Mechanical vibration. Road surface profiles. Reporting of measured data,” Switzerland. Standard No. ISO 8608, 2016.
-
G. Rill, Road Vehicle Dynamics. CRC Press, 2011, https://doi.org/10.1201/9781439897447
-
L. Zhao, Y. Yu, C. Zhou, S. Mao, and F. Yang, “Simulation of vertical characteristics and in-wheel motor vibration of electric vehicles with asymmetric suspension damper under road impact,” International Journal of Modelling and Simulation, Vol. 39, No. 1, pp. 14–20, Jan. 2019, https://doi.org/10.1080/02286203.2018.1468991
-
“Mechanical vibration and shock – evaluation of human exposure to whole-body vibration. part 1: general requirements,” International Organization for Standardization (1997) ISO 2631-1:1997, 1997.
-
G. Verros, S. Natsiavas, and C. Papadimitriou, “Design optimization of quarter-car models with passive and semi-active suspensions under random road excitation,” Journal of Vibration and Control, Vol. 11, No. 5, pp. 581–606, Aug. 2016, https://doi.org/10.1177/1077546305052315
About this article

We acknowledge Ho Chi Minh City University of Technology (HCMUT), VNU-HCM for supporting this study.
The datasets generated during and/or analyzed during the current study are available from the corresponding author on reasonable request.
Huu Nhan Tran: conceptualization, methodology, supervision, validation, writing – review and editing. Ngoc Dai Pham: data curation, software, visualization, formal analysis, resources, writing – original draft preparation.
The authors declare that they have no conflict of interest.
